Matplotlib is a low level graph plotting library in python that serves as a visualization utility. Matplotlib was created by John D. Hunter. Matplotlib is open source and we can use it freely. Matplotlib is mostly written in python, a few segments are written in C, Objective-C and Javascript for Platform compatibility.
Official Website
The official website for matplotlib is matplotlib.org. To see some examples of plots go to examples.
You might want to set some standards with your plots. Here’s some code you can start with. This is of course, optional.
import matplotlib.pyplot as plt
plt.rc('font', size=12)
plt.rc('axes', labelsize=14, titlesize=14)
plt.rc('legend', fontsize=12)
plt.rc('xtick', labelsize=10)
plt.rc('ytick', labelsize=10)
A First Plot
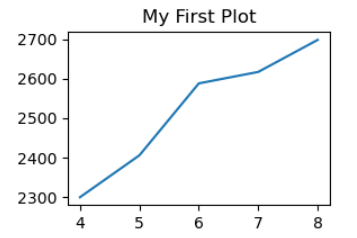
Here is a very simple plot to start with. It’s just to illustrate how easy it is to create a simple plot. I created a project in Anaconda Navigator’s Jupyter Notebook called Matplotlib Introduction to practice this. When we use the code plt.plot, we get a line plot by default.
import matplotlib.pyplot as plt
# build our plot
fig = plt.figure(figsize =(3, 2))  # width and height of graph
data_x = [4, 5, 6, 7, 8]
data_y = [2300, 2406, 2588, 2617, 2698]
plt.title('My First Plot')
plt.plot(data_x,data_y)
plt.show()