- Bar Charts in Tableau
- Stacked Bar Chart in Tableau
- Stacked Bar Chart 2 in Tableau
- Bar Chart with Hierarchy
- Shared Axis Bar Chart
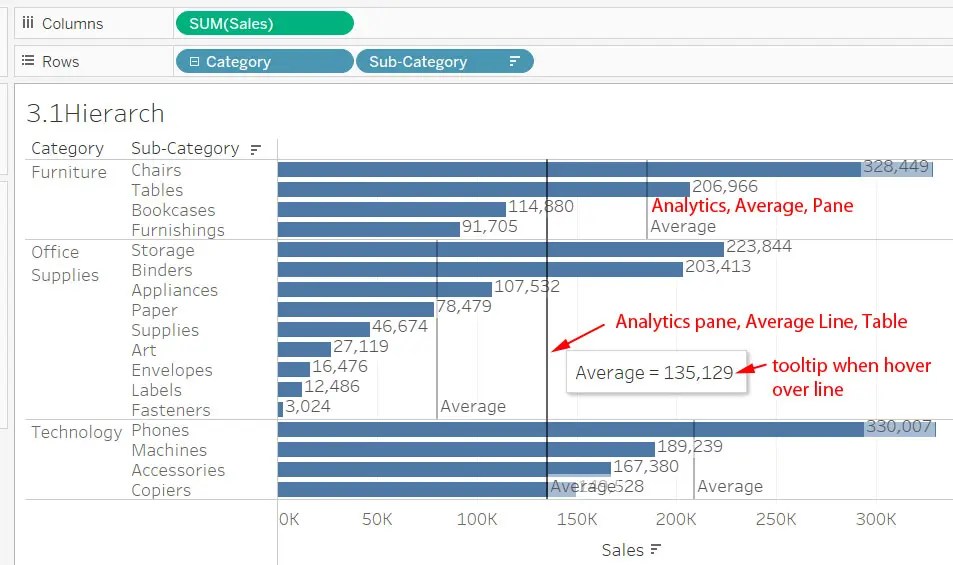
This post discusses how to create a bar chart in Tableau showing a continuous quantitative variable, such as Sales, split by two qualitative variables that have a hierarchical relationship, such as a Category and a Sub-category. This could be a product category that has sub-categories within each category.
We have several sub-categories that would look better as a horizontal bar chart because the labels would be easier to read down a column at the left of the chart.
In the rows and columns section, we have one measure and two dimensions. Another way of saying this is that we have one numeric variable and two categorical variables.
Tableau’s web site has help with bar charts.