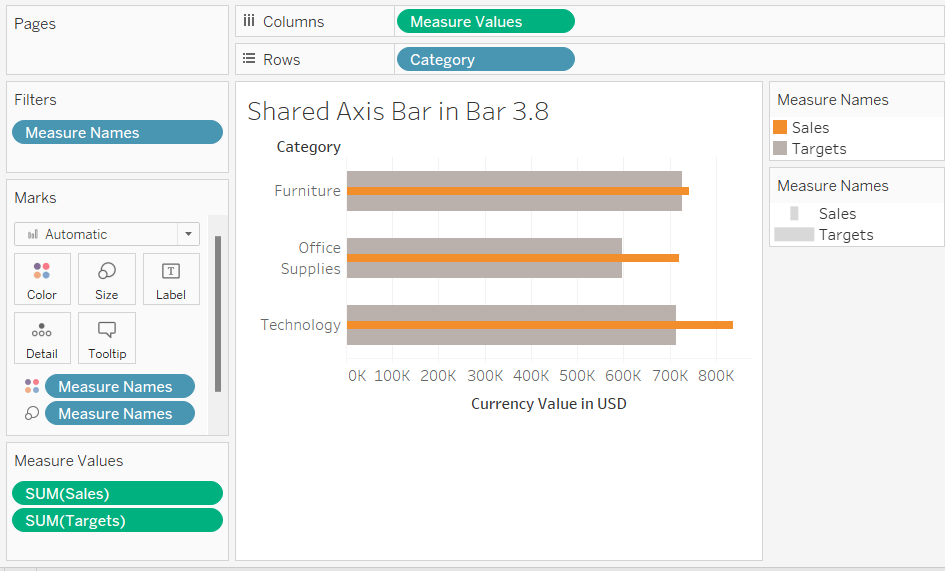
In Tableau, are you needing to chart showing two measures (numerical) and one category? For example, suppose you have budget and actual sales figures and you want it broken down by category. How do you set up a shared axis? Suppose our axis is on the left side (where the y-axis is) where we have budget and actual. On the x-axis we have the numerical currency amount.
I will use the Superstore dataset.
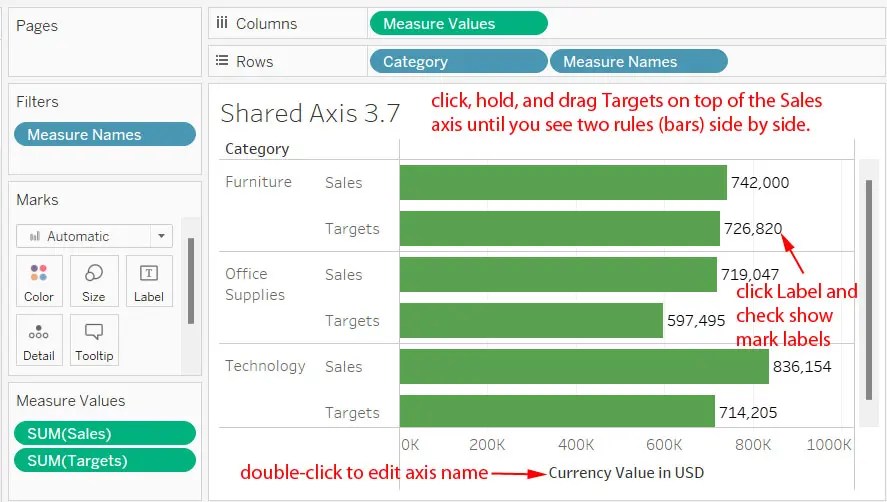
Move