Measures of position let you determine the position of a value in relation to other values in a dataset. Along with center and dispersion, it’s helpful to know the relative position of your values. For example, whether one value is higher or lower than another, or whether a value falls in the lower, middle, or upper portion of your dataset.
The median is the value separating the higher half of a data sample, a population, or a probability distribution, from the lower half. In simple terms, it may be thought of as the “middle” value of a data set.
A percentile is the value below which a percentage of data falls. Percentiles divide your data into 100 equal
parts. Percentiles give the relative position or rank of a particular value in a dataset. For example, percentiles are commonly used to rank test scores on school exams. Let’s say a test score falls in the 99th percentile. This means the score is higher than 99% of all test scores. Percentiles start counting from the bottom.
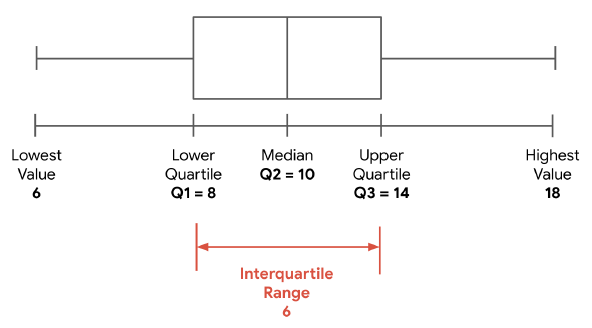
Quartiles divide the data into four equal parts. The interquartile range: The distance between the first quartile (Q1) and the third quartile (Q3).
In Python you can use the quantile() function, as shown bellow.
df['my_column'].quantile([0.25, 0.5, 0.75])