In statistics we want to look at measures of central tendency, asymmetry, and variability.
Univariate Measures
What is a univariate measure? Univariate is a common term that you use in statistics to describe a type of data that contains only one attribute or characteristic. Some univariate data consists of numbers (such as height or weight), while others are nonnumerical (such as brown or blue) or categorical. Generally, the terms categorical univariate data and numerical univariate data are used to distinguish between these types. For univariate variables we’ll look at measures of central tendency, asymmetry, and variability. For exploring relationships between variables, we’ll look at covariance and the linear correlation coefficient, in another post.
Central Tendency
The term average can have four different meanings: mean, median, mode, and midrange. Using only one of these four in your analysis is not recommended. You must use at least two, and preferably the mean and median.
Mean The mean is calculated by summing all of the data elements and dividing by the number of elements. The mean of the set 2, 3, 4, and 5 is (2 + 3 + 4 + 5)/4 = 3.5. Here is the formula for sample mean. The population mean is similar but uses a capital N instead of a small case n. In Excel you can use the AVERAGE() function to calculate the mean.

Median The median is the middle value, after the data has been sorted. The median of the set 3, 4, 5, 6, 8 is 5.
Mode The mode is the most frequently occurring data value. The mode of the set 2, 3, 3, 6, 6, 6, 7 is 6.
Midrange The midrange is the midpoint between the highest and lowest values. The midrange of the set 2, 4, 5, 7, 10 is 6, which is calculated as 
Asymmetry and Skewness
Skewness is the most common measure of asymmetry. Skewness indicates whether the observations in a data set are concentrated on one side. When we have right skewness, the mean is bigger than the median, and the mode is the value with the highest visual representation. If the mean is lower than the median, we say that there is a negative or left skew. Excel has a function for calculating skewness. It’s SKEW().
The next topic will be measures of relationship between two variables. It will include covariance and linear correlation coefficient. Imagine you have data fro the height and weight of a handful of people. You would expect that the taller the person, the more the weight of the person, generally. Consider house prices. You would expect larger houses to cost more.
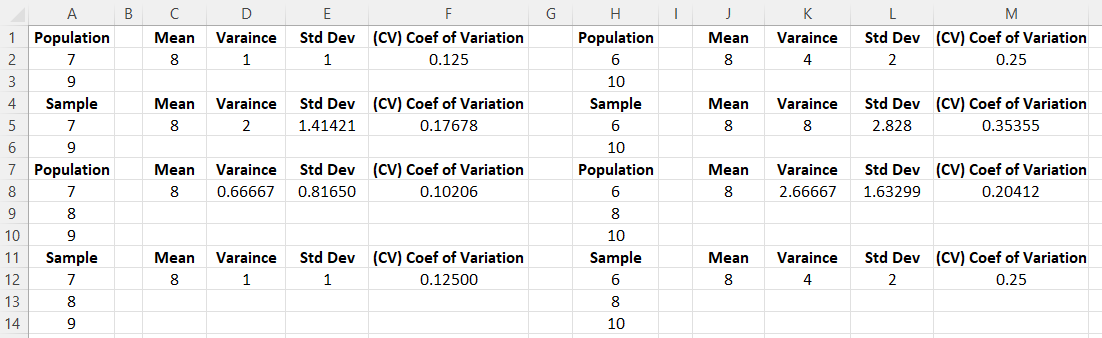
Below are a few examples in Excel.