Are you starting out in your exploration of what it is like to be a data professional? This is a good place to start. We need to understand the different types of variables we will be working with in our datasets. To do that we will classify data because different types of variables require different types of statistical and visualization approaches.
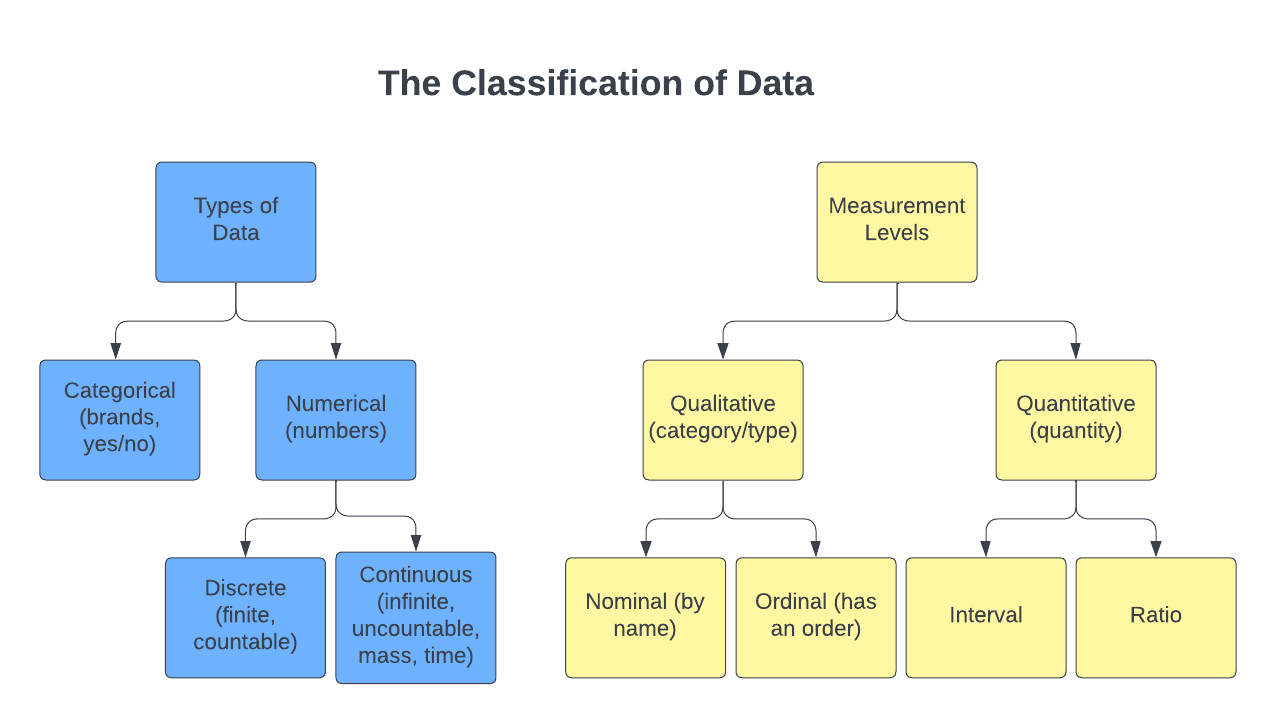
We classify data in two main ways: type of data and the measurement levels
Quantitative Relationships
Numbers all by themselves don’t have any meaning. But numbers can tell a story depending on what they are related to. Numbers might measure sales, but we also need to know sales of what, and when, and perhaps where. We might be working with units of a product sold in a geographic region. We might be interested in company revenue by quarter last lear. We might be working with cases of Covid. Quantitative stories have two types of data: quantitative and categorical.
Relationships Within Categories
We use categories to put labels on measures. According to Stephen Few in his book Show Me the Numbers, categorical items that we use in graphs and tables to label corresponding measures can relate to one another in the following four ways: Nominal, Ordinal, Interval, and Hierarchical.
Nominal Only names are meaningful here. Nominal is a level of measurement which classifies data into mutually exclusive, all-inclusive categories in which no order or ranking can be imposed on the data. An example is North, South, East and West. It could be a list of countries that an organization operates in. It could be sales in dollars by department. The departments do not relate to one another in any particular way, but we may wish to relate the quantity of the sales by sorting (ranking) them in a chart.
Ordinal adds an order to the names. Ordinal is a level of measurement which classifies data into categories that can be ranked or “put in order”. Differences between the ranks do not exist. Perhaps we are working with fashion products and we wish to list them in order by size, such as small, medium; large, and extra large. We might place items in order of quality such as best, second best, and third best. In a survey, people might wish to describe a product or service as excellent, very good, good, fair or poor. There is some natural ordering, but it is limited since we do not know by how much “Excellent” is better than “Very good”.
Interval adds meaningful differences. An Interval relationship is one in which the categorical items consist of a sequential series of numerical ranges that subdivide a larger range of quantitative values into smaller ranges. An example would be household income ranges or age ranges of people. Sometimes we’ll use the term bin to describe a range.
Hierarchical A hierarchical involves multiple categories that are closely associated with one another as separate levels in a series of parent-to-child connections. Starting at the top of the hierarchy progressing down, each item is associated with only one item above it. A corporation may have divisions, and under that it may have departments and then groups.
Relationships Between Quantities
Categorical items can relate to one another because of the quantitative values associated within them. The quantitative values can be arranged to display the following relationships: Ranking, Ratio, and Correlation.
Ranking. When the order in which the categorical items are displayed is based on the associated quantitative values, either descending or ascending, the relationship is called a ranking. This is sorting.
Ratio A ratio is a relationship that compares two values by dividing one by the other. An example would be the sales of one region compared with the sales of all the regions. The ratio of a part to its whole is generally expressed as a percentage.
Correlation. A correlation compares two paired sets of quantitative values to determine whether increases in one correspond to increases or decreases in the other. Does the number of medications a person is on correlate to their age in years?
Summarizing Numbers
With statistics we can reduce the amount of data we are considering. Another word for summarizing is aggregating. One aggregate example is the sum. Another aggregation is the count. For example, the total number of sales orders for last month for for a product.
Discrete and Continuous Numbers
Discrete variables are usually obtained by counting. There are a finite or countable number of choices available with discrete data. You can’t have 2.63 people in the room. Continuous variables are usually obtained by measuring. Length, weight, and time are all examples of continuous variables. Since continuous variables are real numbers, we usually round them. This implies a boundary depending on the number of decimal places. For example, a data element of value 64 may really represent anything greater than or equal to 63.5 and less than 64.5. Boundaries always have one more decimal place than the data and end in a 5.