Exploratory Data Analysis (EDA) has six main practices. The six main practices of EDA are discovering, structuring, cleaning, joining, validating and presenting. This post discusses the third practice, cleaning. EDA is not a step-by-step process you follow like a recipe. It’s iterative and non-sequential.
You have a dataset in Python. You are using the pandas library and are therefore working with a DataFrame. We’ll create a variable to hold the dataset and call it df (short for DataFrame). Does the dataset have any duplicates? How many unique rows are there? By rows I mean complete rows that contain all of the columns.
In your initial exploratory data analysis (EDA), during the Cleaning phase, you will likely use a few functions or attributes such as head(), size and shape.
Count the Duplicates
If your DataFrame is named df, you can use duplicated(). That returns an exact count of the number of duplicates.
df.duplicated().sum()
In our DataFrame we can count the number of duplicate rows. All columns will need to be the same.
df.shape
df.drop_duplicates().shape
Calculate what percentage of the data is duplicated.
perc = df.duplicated().sum() / df.shape[0]
print('{:.2%}'.format(perc) + ' is duplicated')
If the shape of the data is different after running the second line of code, we’ll know there were duplicate rows. By subtracting the two numbers (the first number is the rows, which is the one we are looking at) we can get the number of duplicate rows.
# Check for duplicates
print('Shape of dataframe:', df.shape)
print('Shape of dataframe with duplicates dropped:', df.drop_duplicates().shape)
duplicated()
The duplicated() function will only return entire rows that have exactly matching values, not just individual matching values found within a column.
Check for duplicates in a specific column.
How Many Duplicates?
How do you count the number of duplicates in a dataset. Suppose the dataset was called df.
# count the number of duplicated rows in our dataset
duplicated(df).sum()
Inspect Some of the Duplicates
This will show the first 5 duplicates because the default value of head() is 5.
df[df.duplicated()].head()
Should I Drop the Duplicates?
Every dataset is unique and you cannot treat every dataset the same. When you are making the decision on whether to eliminate duplicate values or not, think deeply about the dataset itself and about the objective you wish to achieve. What impact will dropping duplicates have on your dataset and your objective? You should drop or eliminate duplicate values if duplicate values are clearly mistakes or will misrepresent the remaining unique values in the dataset.
Let’s actually drop the duplicates. Suppose you have a DataFrame called df0. After the duplicates are removed, you want to be left with a different DataFrame because you want to preserve the original DataFrame in case you need to go back to it. Please delete rows with caution. Keep is optional, and the default is ‘first’. Keep can be ‘first, ‘last’ or False. Keep specifies which duplicate to keep. If False, drop ALL duplicates. In other words, it drops all the rows associated with being a duplicate. If in the original dataset there are two rows that are exactly the same, keep=False will drop both rows!
You should keep duplicated data in your dataset if the duplicate values are clearly not mistakes and should be taken into account when representing the dataset as a whole.
Drop the Duplicates
Whenever you drop duplicates, it’s a good idea to store the result in a new DataFrame, as shown below. This way you can always go back to check out the original DataFrame in case you need to.
df1 = df0.drop_duplicates(keep='first')
DataFrame.duplicated(subset=None, keep=’first’)
We can get a dataset of ALL of the rows that are involved in the duplicate issue. If we use keep=’False’ then we get the original row as well as the duplicate row. But what if we have a triplet?
keep
{‘first’, ‘last’, False}, default ‘first’
Determines which duplicates (if any) to mark.
first : Mark duplicates as True except for the first occurrence.
last : Mark duplicates as True except for the last occurrence.
False : Mark all duplicates as True.
A Simple Example
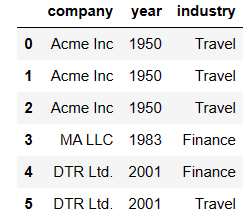
I will create a project called Duplicates in pandas DataFrame. and manually create a dataset with pandas.
import pandas as pd
data = {'company': ['Acme Inc', 'Acme Inc', 'Acme Inc', 'MA LLC', 'DTR Ltd.', 'DTR Ltd.'],
        'year': [1950, 1950, 1950, 1983, 2001, 2001],
        'industry': ['Travel', 'Travel', 'Travel', 'Finance', 'Finance', 'Travel']
         }
df = pd.DataFrame(data)
df
# count the number of duplicated rows in our dataset
# Acme Inc on on index 1 and 2 are duplicates
print(df.duplicated().sum())
print('There are {} duplicates in the dataset.'.format(df.duplicated().sum()))
2
There are 2 duplicates in the dataset.
# count the number of duplicated 'company' only
# Acme Inc and DTR Ltd.
print(df.duplicated(subset=['company']).sum())
3
# count the number of duplicated 'company' and 'year'
# Acme Inc and DTR Ltd.
print(df.duplicated(subset=['company','year']).sum())
3
Notice that there are now 3 duplicates, not 2. It depends how we define “duplicate”. When we first counted the duplicates, the function needed to see the same information in all of the columns. We can specify what a duplicate really means for us by including a list of columns. Here we chose to define a duplicate as those rows with the same data in ‘company and ‘year’.
perc = df.duplicated().sum() / df.shape[0]
print('{:.2%}'.format(perc) + ' is duplicated')
33.33% is duplicated