Exploratory Data Analysis (EDA) has six main practices. The six main practices of EDA are discovering, structuring, cleaning, joining, validating and presenting. This post discusses the third practice, cleaning. EDA is not a step-by-step process you follow like a recipe. It’s iterative and non-sequential.
There are three kinds of outliers.
- Global outliers
- Contextual outliers
- Collective outliers
In your initial exploratory data analysis, you might want to use describe() to get some descriptive statistics on your data.
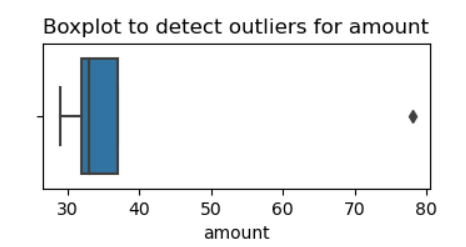
Another way to check for outliers is to create a boxplot. Let’s consider a simple example. You have a DataFrame called df. You have a column called amount. You can use seaborn to create a boxplot.
Some models are more sensitive to outliers than others. Deciding whether to remove outliers may depend on the model you are using.
Very Simple Example
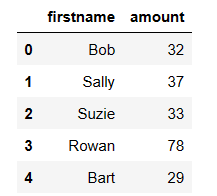
Here is a very small dataset that I’ve manually created in a project called Outliers Boxplot in python.
import pandas as pd
import matplotlib.pyplot as plt
import seaborn as sns
data = {'firstname': ['Bob', 'Sally', 'Suzie', 'Rowan', 'Bart'],
       'amount': [32, 37, 33, 78, 29]}
df = pd.DataFrame(data)
# Create a boxplot to visualize distribution of `amount` and detect any outliers.
# We can see that Rowan is an outlier just by looking at the original small dataset.
plt.figure(figsize=(4,1.5))
plt.title('Boxplot to detect outliers for amount', fontsize=12)
plt.xticks(fontsize=10)
plt.yticks(fontsize=10)
sns.boxplot(x=df['amount'])
plt.show()
Below is the screenshot from Jupyter Notebook.