Exploratory Data Analysis (EDA) has six main practices. The six main practices of EDA are discovering, structuring, cleaning, joining, validating and presenting. This post discusses the third practice, cleaning. EDA is not a step-by-step process you follow like a recipe. It’s iterative and non-sequential.
Do you have a dataset of rows and columns with some missing data in a column? If there is not “too much” missing data then perhaps we can use this method called imputation. What is imputation? Data imputation is the process of replacing missing data with substituted values in a dataset. The concept is similar to a search and replace operation.
Titanic Dataset
What if your column had Ages of people (in years). Suppose you noticed that older people spend more money on average than younger people, so you decided to put the mean age for three levels of money spent. It’s a rough guess, but it might be better than just dropping the rows from the dataset. Those rows contain data from other columns. The Titanic dataset has an Age column that’s missing some values. In that dataset we have a “Pclass” column that represents a first class, second class and third class ticket. Could we use the Pclass column to impute the age of the passenger?
To answer that question, we could take a look at our Titanic data. I will use Jupyter Notebook in Anaconda Navigator to run this Python project by downloading and copying the two datasets to my local machine. This discussion will move quickly through the code.
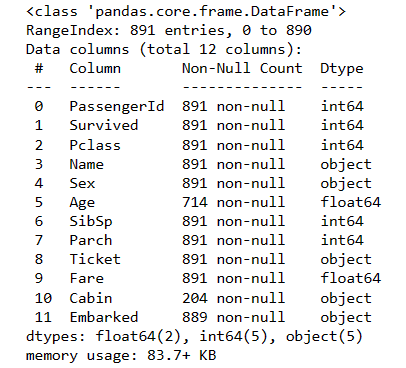
import numpy as np
import pandas as pd
import matplotlib.pyplot as plt
import seaborn as sns
df = pd.read_csv(r"titanic_train.csv")
df_test = pd.read_csv(r"titanic_test.csv")
df.info()
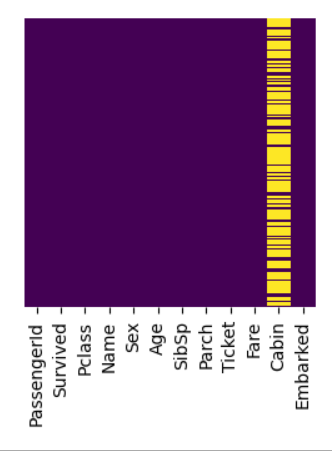
I will use seaborn to see those nulls graphically.
# let's see those nulls graphically
plt.figure(figsize =(3, 3))
sns.heatmap(df.isnull(), yticklabels=False, cbar=False, cmap='viridis')
Here is what that look like.

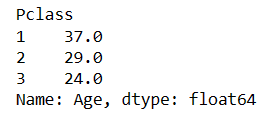
In the Age column there are 714 non-nulls and 177 nulls. For each of those 177 nulls, we are going to put in the median age for each of the three classes, 1, 2, and 3. First we need to get the median ages of the three classes with a groupby.
ser_median_age_by_class = df.groupby(by="Pclass")['Age'].median()
ser_median_age_by_class
Let’s see this graphically with a boxplot in seaborn.
plt.figure(figsize=(4,3))
sns.boxplot(x='Pclass', y='Age', data=df)  # df is training data
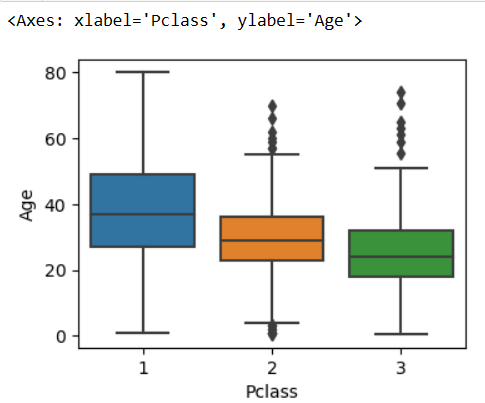
We can see that first class passengers are generally the oldest passengers, with second class being a bit older than third class passengers.
Custom Function, then Apply
We need to go through the dataset row by row. For each row we need to look at the Pclass and add an Age to the Age column (if it is null in Age). We will add the median age of the Pclass.
# write a function
# impute the age column based on the Pclass column
def impute_age(cols):
    Age = cols[0]
    Pclass = cols[1]
    # the 37, 29 and 24 are medians
    if pd.isnull(Age):
        if Pclass == 1:
            return 37
        elif Pclass == 2:
            return 29
        else:
            return 24
    else:
        return Age
# run the function
df['Age'] = df[['Age','Pclass']].apply(impute_age,axis=1)
# view the results grahically
plt.figure(figsize =(3, 3))
sns.heatmap(df.isnull(),yticklabels=False,cbar=False,cmap='viridis')
We’ve done it.