Let’s work with confidence intervals with two means and independent samples. Let’s work with data where we know the population variances.
The example here will be the grades of two groups of students that are from two completely separate departments with different classes and teachers. The grade of an engineering student does affect in any way the grade of a management student. We want to find the difference in the grades of engineering and management. Do management students get higher grades? Also, from prior years, we know the population variance. We want to create a confidence interval. Also, populations are presumed to follow the normal distribution.
| Dependent Samples | Independent Samples |
|---|---|
|
|
We will use the z statistic because our samples are relatively large, we know the population variance and we assume that grades follow a normal distribution.

The above formula is the variance of the difference. We have an example below from the Udemy.com course Statistics for Data Science and Business Analysis. I made minor changes to the Excel file.
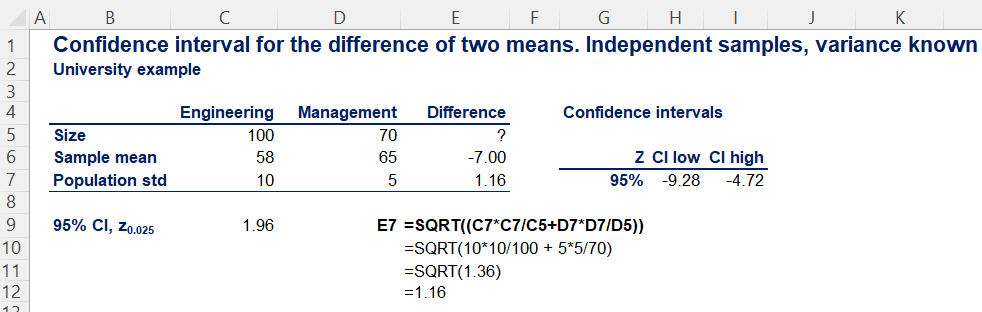
What’s the formula for calculating the interval for a given confidence level? Let’s say we want 95% confidence.

The above formula is the confidence interval formula in this case.