The previous series of posts was called Inferential Statistics.
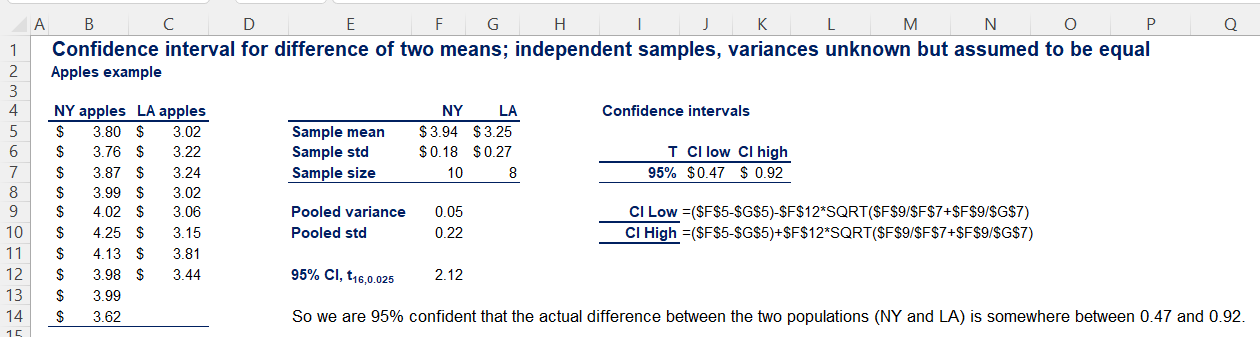
Let’s now compare “apples to apples”. Last time we looked at students’ grades from two different school departments. That was in our independent samples post. Now we’ll look at the price of apples in two different locations. Suppose we get some small samples, one from one US state and one from another state. We don’t know the population variance. We don’t have the financial means to go to or call every store in each state to get the price of apples. We’ll assume though that the variances (or standard deviations) are equal. We’ll just randomly call some of them in each state. Our sample sizes are different. We can calculate a sample mean and standard deviation for each state.
| Dependent | Independent |
|---|---|
|
|
This example is based on an example in the Udemy.com course called Statistics for Data Science and Business Analysis.
We assumed that the population variances are equal, so we have to estimate them. The unbias estimator in this case is called the pooled sample variance.

When we were working with the grades of two sets of students, we knew the population variance and used the T statistics. Here, we don’t know the population variance so we need to use the Student’s T statistic.

In the above formula the t statistics is a bit different from what we’ve seen before. The degrees of freedom is equal to the total sample size minus the number of variables. We are comparing 2 groups of apples so the number of variables is 2. The total sample size is the number of samples in the first group (US state) plus the number in the second group (US state).
Here is the “apples to apples” example from the Udemy.com course called Statistics for Data Science and Business Analysis.
The next series of Statistics posts is on hypothesis testing.