Transforming data is one of the steps in the Data Analytics/Analysis life cycle.
In the Google Analytics Certificate course in R, they talk about cleaning, organizing, and transforming data, in that order.
Transformational functions separate and combine data as well as create new columns (“variables” in R). Examples are separate(), unite(), and mutate().
Cleaning functions help you preview and rename data so that it’s easier to work with. Examples would be rename(), clean_names(), skim_without_charts(), glimpse(), rename_with(), select().
Organizational functions help you sort, filter, and summarize your data. Some examples are min(), max(), mean(), arrange(), group_by(), drop_na(), filter(), and summarise(). The arrange function sorts our data.
An Example Data Frame
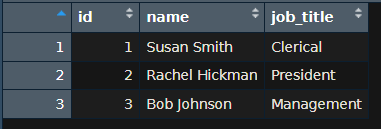
We’ll manually create a very small data frame. Feel free to copy this code into RStudio and create a script. Of course, you could use your own data as well. Notice that the data frame is like a table. It is called employee and it has three columns: id, name and job_title.
id <- c(1:3)
name <- c("Susan Smith", "Rachel Hickman", "Bob Johnson")
job_title <- c("Clerical", "President", "Management")
employee <- data.frame(id, name, job_title)
print(employee)
Here below is what it looks like in RStudio.