This function gives us a pretty comprehensive summary of a dataset. We get the number of rows and columns. It shows the frequency of the different types. It is part of the skimr package. glimpse is another way to get a summary of the data. If you click on that like you will see what glimpse provides when working with the palmer penguins dataset.
Friends Dataset
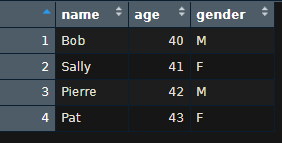
Here is a very small dataset called friends. I created it from nothing. It is created manually in the code below. It’s just for demonstration purposes and doesn’t mean anything. In RStudio you can create a new project and then create a new script. If you copy and paste this code into the script file, select all the code and click the Run button you can see what skim_without_charts() produces. In the last line you get the mean, which is 41.5. You can see that the 50th percentile is 41.5. The median is the middle value of a set of numbers, which is the same as the 50th percentile for the set of numbers. In other words, the median is the middle of a set of numbers with half of the values less than the median and half the values greater than the median.
library(skimr)
name <- c("Bob", "Sally", "Pierre", "Pat")
age <- c(40, 41, 42, 43)
gender <- c("M", "F", "M", "F")
friends <- data.frame(name, age, gender)
skim_without_charts(friends)
── Data Summary ────────────────────────
                           Values
Name                       friends
Number of rows             4
Number of columns          3
_______________________
Column type frequency:
  character                2
  numeric                  1
________________________
Group variables            None

── Variable type: character ─────────────────────────────────────────────────────────────────────────────────────────────────────
  skim_variable n_missing complete_rate min max empty n_unique whitespace
1 name                  0             1   3   6     0        4          0
2 gender                0             1   1   1     0        2          0

── Variable type: numeric ───────────────────────────────────────────────────────────────────────────────────────────────────────
  skim_variable n_missing complete_rate mean   sd p0  p25  p50  p75 p100
1 age                   0             1 41.5 1.29 40 40.8 41.5 42.2   43
For the age, we have a few statistics to look at. In the last line of the output, we get mean, standard deviation, the minimum (percentile 0), the 25th percentile p25 (which means that 25% of the values are below 40.8 in this case), the 50th percentile (which is the median), the 75th percentile and the 100th percentile (which is the maximum).
Palmer Penguins Dataset
We can try this out on the palmer penguins sample dataset. Here’s what we get.
> skim_without_charts(penguins)
── Data Summary ────────────────────────
                           Values
Name                       penguins
Number of rows             344
Number of columns          8
_______________________
Column type frequency:
  factor                   3
  numeric                  5
________________________
Group variables            None

── Variable type: factor ───────────────────────────────────────────────────────────────────────────────────────────────────────
  skim_variable n_missing complete_rate ordered n_unique top_counts
1 species               0         1     FALSE          3 Ade: 152, Gen: 124, Chi: 68
2 island                0         1     FALSE          3 Bis: 168, Dre: 124, Tor: 52
3 sex                  11         0.968 FALSE          2 mal: 168, fem: 165

── Variable type: numeric ──────────────────────────────────────────────────────────────────────────────────────────────────────
  skim_variable     n_missing complete_rate   mean      sd     p0    p25    p50    p75   p100
1 bill_length_mm            2         0.994   43.9   5.46    32.1   39.2   44.4   48.5   59.6
2 bill_depth_mm             2         0.994   17.2   1.97    13.1   15.6   17.3   18.7   21.5
3 flipper_length_mm         2         0.994  201.   14.1    172    190    197    213    231
4 body_mass_g               2         0.994 4202.  802.    2700   3550   4050   4750   6300
5 year                      0         1     2008.    0.818 2007   2007   2008   2009   2009
This dataset has 344 rows and 8 columns.
Using skim_without_charts() is part of exploratory data analysis, or EDA. There are several other things you can do when exploring your dataset.
Python
If you were working in Python, you could use describe() to get similar statistics.
skim_without_charts()