
Tableau Dashboard Introduction
Are you interested in creating a dashboard in Tableau? I will create a fairly simple interactive dashboard in […]
Are you interested in creating a dashboard in Tableau? I will create a fairly simple interactive dashboard in […]
Design thinking is a process used to solve human problems in a user-centric way. It uses empathy for […]
Data visualization, also known as “data viz”, is an interdisciplinary field that deals with the graphic representation of […]
There are lots of graphs you could use. Not all are great choices. Many times choosing simple and […]

Excel has the ability to create a chart that is a geographic map showing your data. As a […]

Here is a simple example of how to create a pivot table in Excel that is based on […]
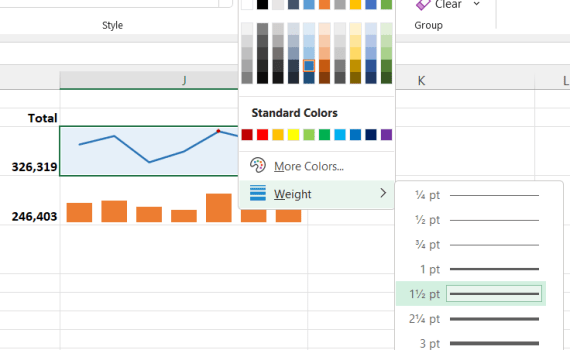
Sparklines were introduced in Excel 2010 to represent data in any tiny chart form without an axis and […]

As an example I will use a simple column chart with only one series of data. It shows […]
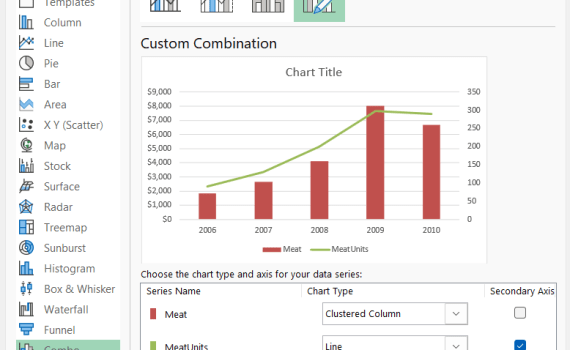
What is an Excel Combo chart? A combo chart in Excel displays two chart types (such as column […]

In this example we will have a simple column chart that will exclude a column of data from […]

Have you ever been frustrated with creating a simple graph showing years in one column and a bunch […]

What is a UML class diagram? Wikipedia says: “In software engineering, a class diagram in the Unified Modeling […]