Sparklines were introduced in Excel 2010 to represent data in any tiny chart form without an axis and coordinates. Sometimes you just want to illustrate some data in a much smaller format than a chart would provide. Sparklines exist in a single cell and are typically used to show the trends or variations in numbers entered in your sheet.
You can add sparklines form the Insert menu in Excel. Go to the Insert menu to find the three choices under Sparklines.

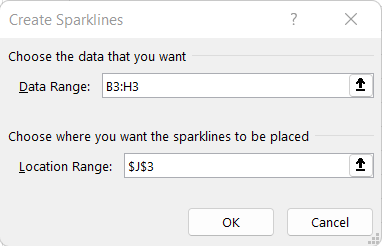
Below is the Create Sparklines dialog.
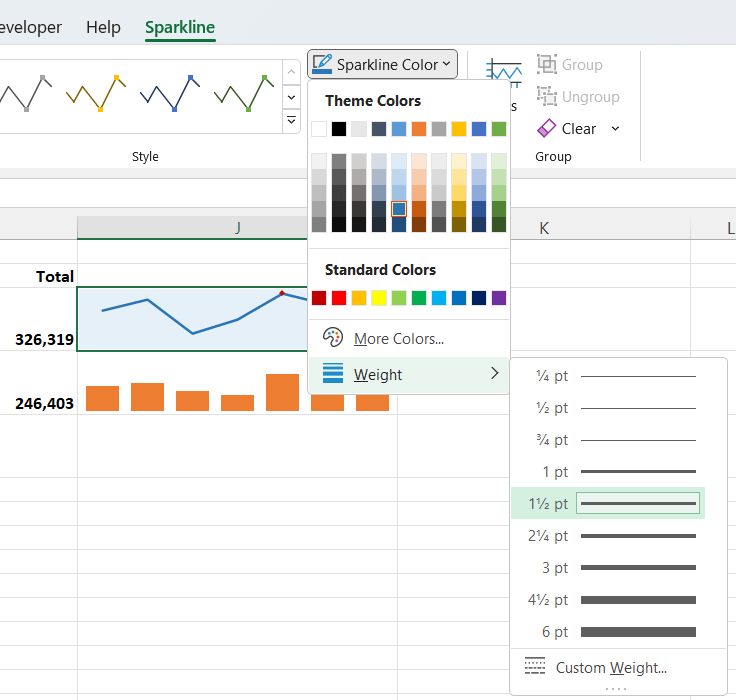
Here below is another sparkling I created along with the data in the sheet. I added markers by checking the check box in the menu. They are the little red dots on the line chart.

Tip
You can save time by creating several sparklines at once by specifying a large range for the data source and a column for the location of the sparklines. Of course they will all need to be the same type of sparkling (such as line or column).
In The Sparkline color allows you to choose a color and even a line weight, as you can see from the screenshot below.