- Simple Linear Regression
- Simple Linear Regression Assumptions
- Simple Linear Regression in Excel
Linear regression analysis is used to predict the value of a variable based on the value of another variable. The variable you want to predict is called the dependent variable. The variable you are using to predict the other variable’s value is called the independent variable. What does the word “simple” mean? In the case of one explanatory variable, it is called simple linear regression, and for more than one, the process is called multiple linear regression.
Use Cases
A simple linear regression analysis can be used to model residential home prices as a function of the home’s living area.
You can use linear regression to predict demand of goods and services. A linear regression model can be used to analyze the effect of a proposed treatment on reducing a medical condition.
An Example
Suppose you work as a data analyst in a manufacturing plant that makes widgets. You suspect that the more widgets you manufacture in a given month, the more your monthly costs are. The independent variable is the number of units produced in a given month. The dependent variable is the monthly cost. You have some clean data. There are no missing values and there appears to be no outliers. I have slightly modified the data. The data is from Wayne L. Winston’s book called Microsoft Excel Data Analysis and Business Modelling, Seventh Edition, in chapter 47 on pages 665 – 672. Chapter 47 is called Estimating straight-line relationships. I have modified the spreadsheet to include unit costs, show the percentage variance, show the four formulas, and add some conditional formatting.
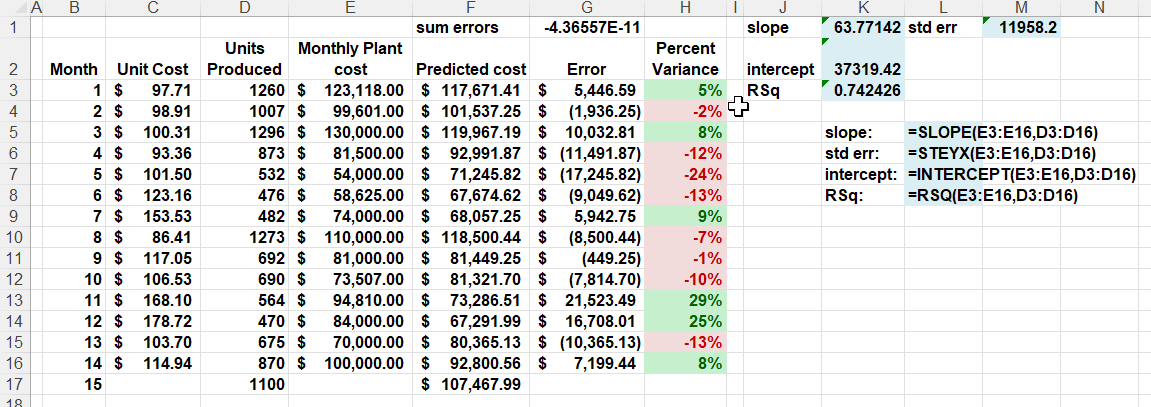
In the above screenshot, the Predicted cost formula for cell for F3 is =$K$1*D3+$K$2. Recall from math class in school that the equation of a straight line is y = m x + c, where m is the slope (gradient) and c is the height at which the line crosses the y -axis, also known as the y -intercept.

The above chart is just the beginning. You can do more with the formatting and data display than what’s shown here.
Note that you should not use a least-squares trendline to predict values of an independent variable that lies outside the range for which you have data.
What is the R-squared value? What percentage of the monthly variation in cost can be explained by the monthly variation in units produced? We can see that the more units we produce, the higher the monthly cost. This makes sense. In this example, the R-squared value is approximately 0.7424. This implies that 74% of the variation in monthly costs can be explained by the number of units produced.
The standard error of regression (SER), in this example, is about $11,958. What does this mean? Approximately 68 percent of the points should be within one standard error of regression of the least-squares line. The absolute value of about 68% of the errors should be $11,958 or smaller. Looking back at the actual data, 11 of the 14 data points fall within one SER. 11 of 14 is about 79%.
95% of the points should be within two SERs of the least squares line. Any point that’s more than two SERs could be considered an “outlier”.
A Super Simple Dataset
In this part I will use a very small and simple dataset to illustrate linear regression in Microsoft Excel.

In Excel, when we plot the dataset we see that it is in fact a straight line. In the real world your data will not look like this, but this is just an example to see what some of the statistics would look like with such a simple dataset that forms a straight line, exactly.

Let’s run a linear regression. Click on Data Analysis in the Data tab.
If the Data Analysis option doesn’t appear on the Data tab, click the File tab, click Options, and then click Add-Ins in the left pane. Then, in the Manage menu, choose Excel Add-Ins and click Go. In the Add-Ins dialog box, select Analysis ToolPak and click OK.
In the Data Analysis dialog box, select Regression and click OK. In the Regression dialog box, point to the range while in the Input Y Range box. This contains the dependent variable or data, including the label y, that you want to predict. While in the Input X Range box, point to the range. This contains the data or independent variables, including the labels, that you want to use in the prediction.
Because the ranges entered in the Input X Range and Input Y Range boxes include labels, select the Labels check box.
For this example, under Output Options, select the New Worksheet Ply option button and type Regression in the corresponding box. This will give the worksheet the name Regression.

