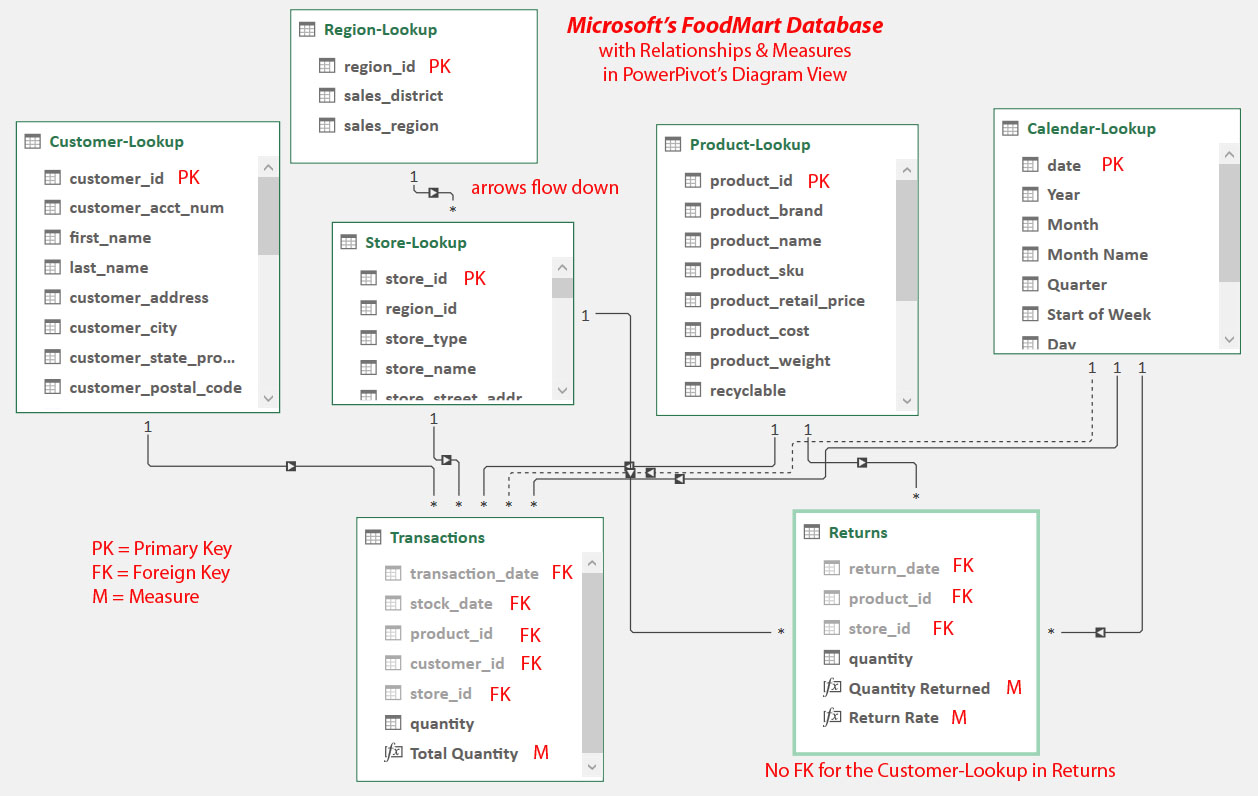
As an example, let’s look at the FoodMart database in Excel’s Power Pivot. The first thing to do in any project like this is to know your database. In Diagram View I have arranged the tables to show the lookup tables at the top and the data tables at the bottom. The direction of the arrows in the lines is important. They all flow down from lookup tables to fact tables. Why is this significant?
Click on the diagram to enlarge it.
In Power Pivot you can analyze data that you have defined relationships for. Not all pivots will work. For those that have problems, you get a yellow relationships warning.
Brand, Total Quantity, and Return Rate
Below is the screenshot for a pivot. We are using the two fact tables (Transactions and Returns) and one of the Lookup tables (Product-Lookup). Everything is fine and okay.

The Customer-lookup table is not related to the Returns table. In the diagram there is no relationship. We cannot create a relationship because the Returns table does not have a customer_id column. This means that we cannot analyze returns using any column from the Customer-Lookup table. What happens if we try to do that? We get a yellow warning and repeating values. This doesn’t work.

We cannot analyze the Customer and Returns table at the same time.
We can however analyze the data using the Transactions table and three other tables: Product-Lookup, Store-Lookup and Customer-Lookup. We can group the data using these three Lookup tables with Transactions because the arrows flow down. We can filter or group on anything that sits “above” the quantitative value. This works as you can see below, because there is no yellow warning.

We’ve created a Measure in the Product-Lookup table called Average Retail Price. The Measure formula is Average Retail Price = AVERAGE(‘Product-Lookup'[product_retail_price]).

Why doesn’t this work? Here’s how Chris Dutton explains it in his Udemy.com course Microsoft Excel: Business Intelligence w/ Power Query & DAX in video 63 near the end of that video: “And because all of our lookups exist on this same level, same plane, anything that I filter in the calendar, in the store, in the region or in the customer lookup table will flow down to the data tables but have no way to flow back up to product lookup. So in other words, product lookup will be blind to any filter in any of these other lookups. And in other words, that means we can’t segment or filter or explore the data using any of those other tables.”
Chris goes on to say: “So we need to pull Store City out. And in this case, since we’ve created the measure on the lookup table itself, that means that the only valid fields to use have to come from the product lookup table.”