Let’s learn about decision trees with a dataset that has only four rows of generic data, and two different classes as a simple example. Similar data can be found in the Udemy course called Python for Data Science and Machine Learning Bootcamp. I changed the column names. This project is using the Python programming language in an Anaconda environment. Go ahead and feel free to copy this code into your own project. This project is a decision tree classifier. Normally you would split the data into training and test sets, but here we do not.
Let’s get right into it. Load the packages we need and manually create our data.
import pandas as pd
import matplotlib.pyplot as plt
from sklearn.tree import DecisionTreeClassifier
# This function displays the splits of the tree
from sklearn.tree import plot_tree
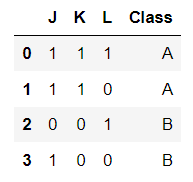
# to manually create a DataFrame, start with a dictionary of equal-length lists.
# The data has been slightly modified from the Udemy course
data = {"J": [1, 1, 0, 1],
"K": [1, 1, 0, 0],
"L": [1, 0, 1, 0],
"Class": ['A', 'A', 'B', 'B']}
df = pd.DataFrame(data)
df
Define the variables.
# Define the y (target) variable
y = df['Class']

# Define the X (predictor) variables
X = df.copy()
X = X.drop('Class', axis=1)
Instantiate the model.
# Instantiate the model
decision_tree = DecisionTreeClassifier(random_state=42)

# We will use ALL of the date to train the model.
# Fit the model to training data
decision_tree.fit(X, y)
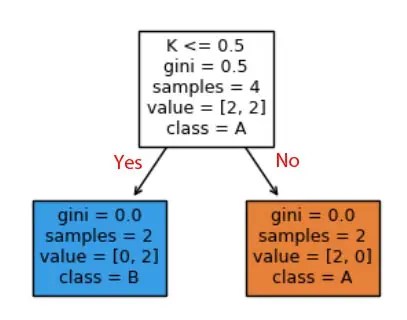
# Plot the tree
plt.figure(figsize=(4,3))

plot_tree(decision_tree, max_depth=4, fontsize=9, feature_names=['J', 'K', 'L'],
          class_names=['A', 'B'], filled=True);
plt.show()
Below is a modified screenshot of the plot. I added the text Yes and No in red.