Tiny Data
In this series of posts (“Tiny IMDB Data Model”) we’ll look at the Internet Movie Database (IMDB) from a data modeling point of view. To do that I will create new tables that have very similar format but use a very tiny amount of my made-up and fake data. This way we can better understand the relationships and results of our pivot tables, without having the wait time involved with the full downloadable IMDB database, which has tens of millions of rows.
The actual downloadable IMDB database is first discussed here in the post called Internet Movie Database. The database contains tens of millions of rows! This series of posts assumes you are familiar with Power Pivot and the Data Model as well as database relationships.
Excel’s Data Model
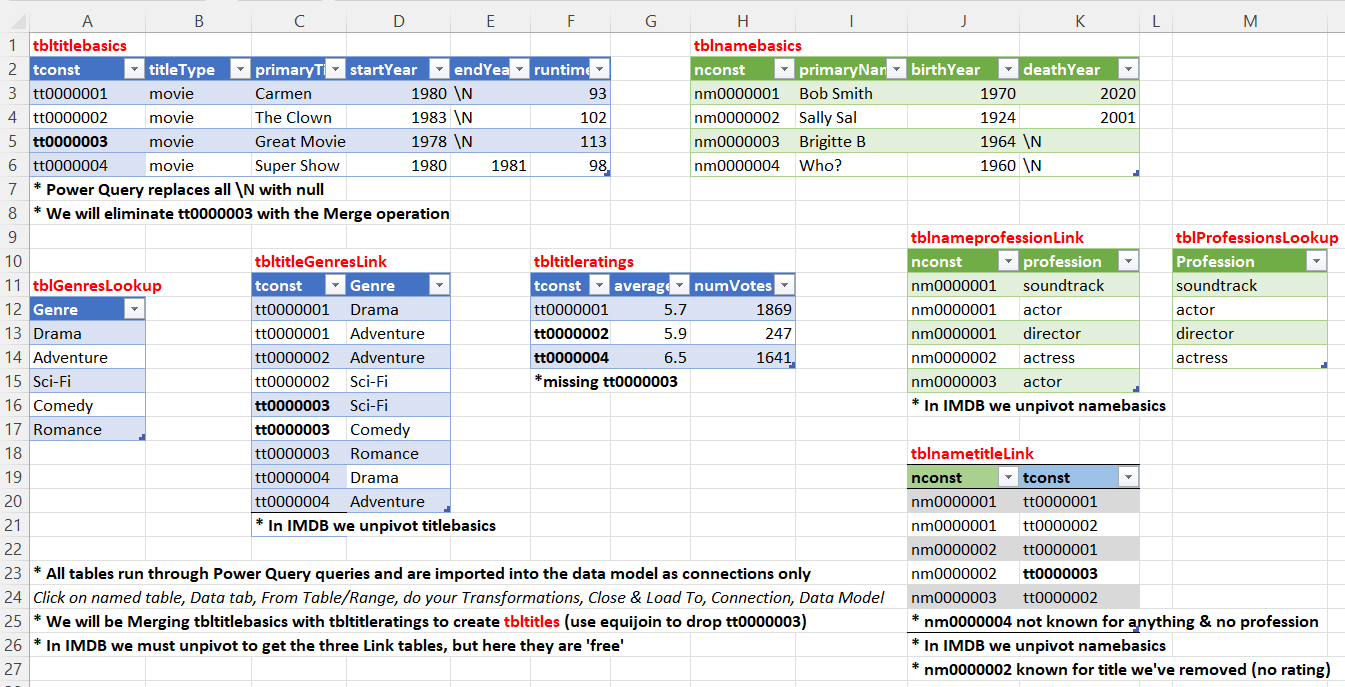
I have modeled the database in Excel using the Data Model. Below is a screenshot of a single sheet in an Excel file that contains some Excel tables that are similar to some of the tables in the original downloadable IMDB database. I have shown the table names in red. The data in the tables is fake and made up. These table are Excel tables created with Ctrl+T. I have added each table to the Data Model. Have a look at the next post for some instructions on how to do that.
Questions
By setting up the model we are able to ask questions about the data. For example, Bob Smith is known for the first and second movies. In other words, he is somehow associated with those two titles. How do we know that? Look at the tblnametitleLink table and find Bob’s Id (nm0000001) and see how many titles are listed for him. There are two. Of the two titles Bob has worked on, what is the average rating of those two titles? To answer that you need to (1) find Bob in the tblnamebasics table and get the nconst Id number. Then move over to the (2) tblnametitleLink table and get all of the movie Ids that Bob is assocated with. In this case it’s the first two. Then we need to go over to the (3) tbltitleratings table and slide over to the averagerating column for each of the two movies and (4) compute an average by adding up the two ratings and dividing by two. The answer is 5.8, which is  . Pivot tables make the answer easily apparent, as shown in the screenshot below.
How To Build the Data Model
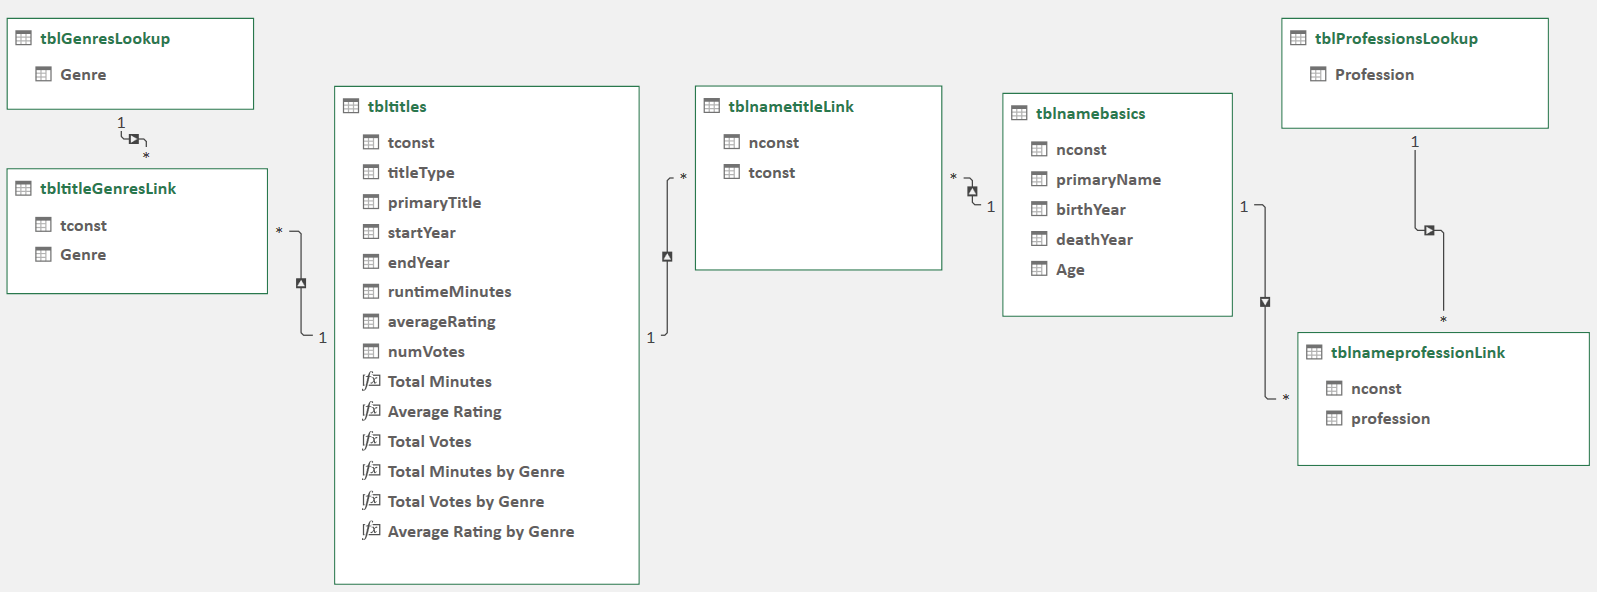
How do we build the data model shown below? Have a look at our next post called Build the Tiny Data Model.
Below is our data model in the Diagram View of Power Pivot. I have created relationships and measures.
More Questions
We could ask questions such as “what is the average rating in each genre?”. We could sort all of the movie titles by average rating with the highest at the top. We could ask which person has the highest number of minutes, or in other words, if we look at all of the movies/titles each person is assocated with/known for and sum the minutes, who has the most minutes. We could request a list of the top 20 movies by average rating in the last ten years.