According to Wikipedia, “The Iris flower data set or Fisher’s Iris data set is a multivariate data set used and made famous by the British statistician and biologist Ronald Fisher in his 1936 paper The use of multiple measurements in taxonomic problems as an example of linear discriminant analysis. It is sometimes called Anderson’s Iris data set because Edgar Anderson collected the data to quantify the morphologic variation of Iris flowers of three related species.”
If you are working in R language, there is an Iris dataset in R.
With Anaconda, I created a Jupyter Notebook called iris Dataset and below is some of the code. Feel free to copy this code into your own project.
import numpy as np
import pandas as pd

# Visualization package imports
import matplotlib.pyplot as plt
import seaborn as sns
from sklearn import datasets
iris = datasets.load_iris()
# np.c_ is the numpy concatenate function
# which is used to concat iris['data'] and iris['target'] arrays
# for pandas column argument: concat iris['feature_names'] list
# and string list (in this case one string); you can make this anything you'd like..
# the original dataset would probably call this ['Species']
df = pd.DataFrame(data= np.c_[iris['data'], iris['target']],
columns= iris['feature_names'] + ['target'])
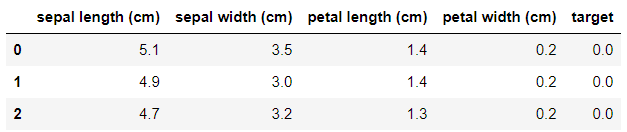
df.head(3)
Could we create a correlation heatmap with seaborn? Tutorialspoint has an article on this.
Seaborn
The visualization library seaborn has the iris dataset builtin.
import seaborn as sns
iris2 = sns.load_dataset('iris')