The Superstore Sales dataset is a public sample dataset provided by Tableau. It is free to use as an Excel file that you can download and use. There are 9994 rows of data in the Orders sheet. It also has a Returns sheet and a People sheets.
This dataset is easy to use because it is “clean”. In the real world, it is more likely that your dataset is not clean and will need to be cleaned. It may be improperly coded, have missing data (incomplete) , not in the right format (dates, strings, numbers) or from a variety of sources that need to be merged. Never assume that the data coming to you is clean. Always verify it by doing a thorough exploratory data analysis.
The short instructional beginner videos on Tableau’s website will use this sample dataset in their illustrations. You can download the dataset and follow along with the videos. In Tableau Public, go to the Resources menu. Click Sample Data. The first dataset listed will likely (unless they change it) be the Superstore Sales dataset. It’s an Excel file.
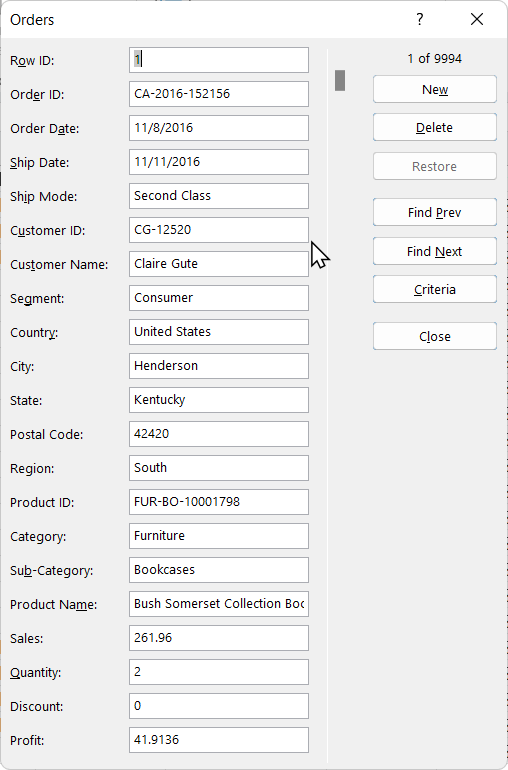
I downloaded the dataset and opened it in Excel to have a look at it. I used Ctrl+T to create a table in the Orders sheet. What does the Orders dataset look like? To show it here, I clicked inside the table and made a form by clicking on the Form button at the Quick Access Toolbar of Excel. Below is what I got when I navigate to the top of the dataset to view the first row.
After loading the dataset in Tableau Public, here is what it looks like before doing any work with it.

Let’s go back to Excel 365 and load the dataset into Power Query. Assuming you created a table of the Orders, click inside the table and click Data, From Table/Range. We can do some data profiling. The data profiling tools provide intuitive ways to clean, transform, and understand query data, such as key statistics and distributions. In the Power Query Editor, go to the View menu. Check the following check boxes at the top of the interface: column distribution and column profile. Among other things, you get the number of unique values in each column. For example, there are 4 different Regions: North, East, South and West.
By default, Power Query profiles data over the first 1000 rows. To change the profile to operate over the entire dataset, in the lower-left corner of your editor, select either Column profiling based on to 1000 rows or Column profiling based on entire data set.
There are 9994 rows and there are 9994 unique values in the Row ID column. Good.
There are 4 Regions: North, East, South, and West. There are 793 different customer names. There is one country, United States. There are 49 different states and 49 distinct states. There are 1862 unique Product IDs. There are three categories: Office Supplies, Furniture, and Technology. There are 17 distinct sub-categories. In the Quantity column, the minimum is one and the maximum is 14. There are 5009 different orders.
Hierarchy
In the Tableau videos the instructor creates some hierarchies. The Location hierarchy has Country, Region, State, City and Postal Code. The Product hierarchy contains Category, Sub-Category, and Product name. While you are doing this you can hide fields you won’t be using.
Dates
There is an important article on working with the dates in the Superstore dataset. The article is called Combining Multiple Date Fields.
Below is a screenshot of a pivot table in Excel showing the sales broken down by category and subcategory.
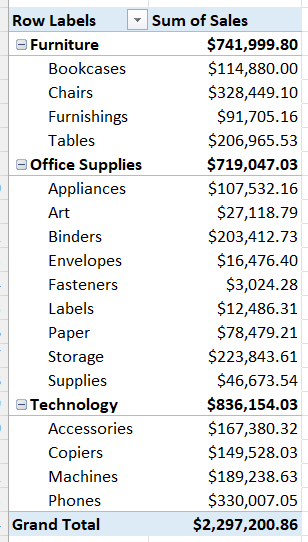
Tableau Public
If you want to practice with this dataset in Tableau Public Desktop, you can get the Excel sheet I made for that purpose over at the bottom of the post called Tableau Public Desktop.
hi