Matplotlib Library Introduction
Matplotlib is a low level graph plotting library in python that serves as a visualization utility. Matplotlib was […]
Matplotlib is a low level graph plotting library in python that serves as a visualization utility. Matplotlib was […]

The bar chart is one of the most common and most important charts. I will loosely follow Corey […]

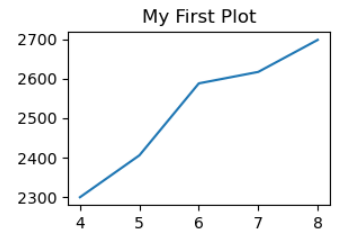
Matplotlib is a library in Python language. In order to write this blog post I created a new […]

Do you want to become more familiar with producing histograms in the matplotlib library of Python? I created […]

How do you create boxplots in Python’s seaborn? Why would you want to create boxplots in the first […]

Let’s create a very simple pie chart using the Python library matplotlib. There is however some controversy with […]
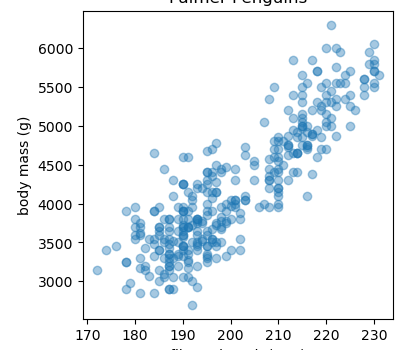
Let’s talk about a very simple scatterplot using the Python library matplotlib and pandas. To create a scatter […]

Are you are a data professional who is interested in generating a histogram in Python? Suppose you are […]