- Simple Decision Tree in Python
- Plot Decision Tree Interpretation
You are modelling a decision tree in Python with the plot_tree function of sklearn.tree. How do you interpret the diagram produced? What do the numbers mean?
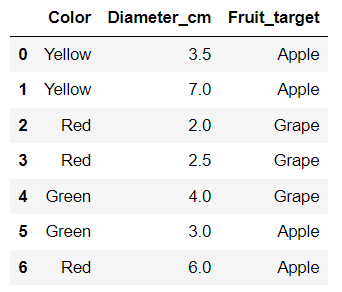
We are trying to predict whether the fruit in question is an apple or a grape based on the color and the size. We have some data in a CSV file that has a color column, a size column in cm and a column called fruit that identifies the actual type of fruit. If we were to have more data that did not identify the type of fruit, but did have the color and size, how well could we identify unknown fruits. It sounds fairly simple, but crab apples can actually be smaller than large grapes. Both apples and grapes can be green or red.
I’m going to jump right to the top of the tree diagram that was produced.
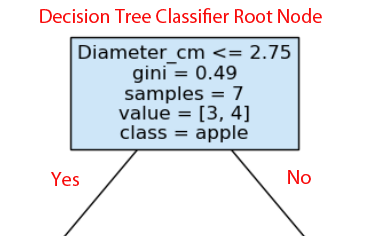
- The first line in each node is the feature and split point that the model identified as being the most predictive.
- gini refers to the node’s gini impurity. It measures how pure a node is. The value can range from 0 to 0.5.
- Samples is how many samples are in that node.
- Value indicates how many of each class are in the node. It’s grapes then apples in this case.
- Class is the majority class of the samples in each node, which is apples in this case.
- Typically, Yes goes to the left and No goes to the right.
Let’s go backwards to the data itself. This is from the Coursera course called Google Advanced Data Analytics Professional Certificate.