I created a project in a Jupyter Notebook under Anaconda that’s called Distribution Plots in Seaborn. For this example, I will use the tips dataset. The tips dataset is a built-in part of seaborn.
import matplotlib.pyplot as plt
import seaborn as sns
tips = sns.load_dataset('tips')
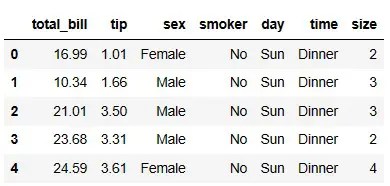
tips.head()
Below is a screenshot of the first few rows of the tips dataset, as produced by the head() function.
We could use distplot, even though it is depreciated
sns.distplot(tips['total_bill'])
I will use histplot() instead.
sns.histplot(tips['total_bill'],kde=True, bins=20)
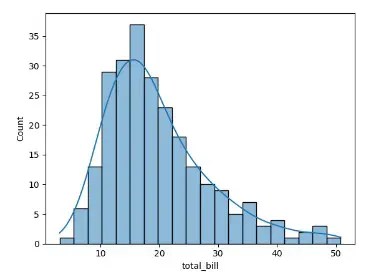
The kde is the kernel density estimate to smooth the histogram, providing complementary information about the shape of the distribution. The following code syntax produces the same result as the above syntax.
sns.histplot(data=tips, x="total_bill", bins=20)