- Introduction to Data in R
- Data Frames in R
Data frames are the data analyst’s default way of interacting with data.
The best way to learn data frames is to jump in and work with them. That’s why R packages have several datasets that are built right in. Diamonds, for example, is a preloaded dataset in the ggplot2 package that is part of the tidyverse. If you haven’t already done so, install the tidyverse with install.packages(tidyverse). Once installed you will need to load it into your session. Run library(tidyverse) and then library(ggplot2). Now run data(“diamonds”). Add this data frame to our data viewer with the command View(“diamonds”).
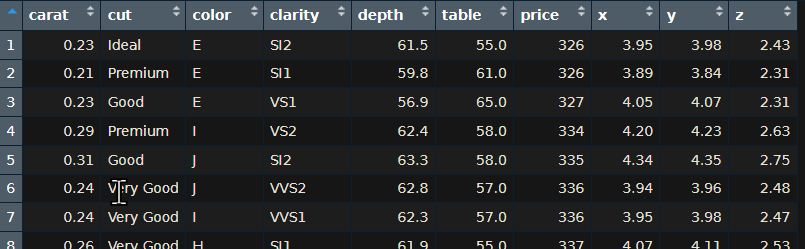
There are 10 columns and 100 rows in this data frame. This is not a large dataset. If you were working with a large dataset you might not want to see all of it. You can preview the dataset with functions. TRry the function head by typing head(diamonds). If you use the console in RStudio, you will see a 6 x 10 tibble of 6 rows and 10 columns. To just get the structure of the data frame, you can use str(), colnames() or glimpse().
Let’s create a tibble from the same diamonds dataset. You can create a tibble from existing data with the as_tibble() function. Run as_tibble(diamonds). Tibbles are data frames, but they tweak some older behaviours to make life a little easier. Tibbles are designed so that you don’t accidentally overwhelm your console when you print large data frames.