
Calculated Fields in Tableau
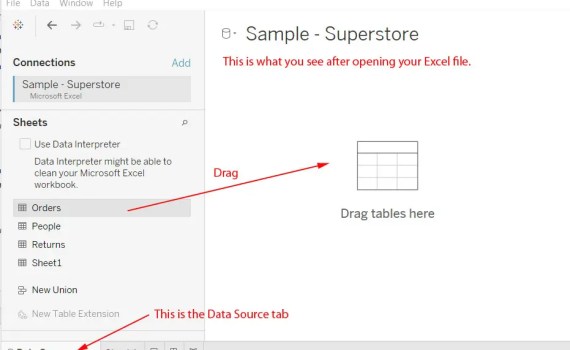
In Tableau, a calculated field performs calculations that may be based on other fields. Think of a spreadsheet […]
In Tableau, a calculated field performs calculations that may be based on other fields. Think of a spreadsheet […]

Tableau, the popular visualization software, uses the terms dimensions and measures. What do these mean? First of all […]
What is Tableau Public Desktop? First of all, Tableau Public is a place on the internet where you […]
Deep learning is a subset of machine learning, which in turn falls under the broader umbrella of artificial […]
57. Let’s do a hypothesis test on a single population. Either we either know the population variance or […]

Every distribution can be standardized. How we can obtain a standard normal distribution from any normally distributed data […]
There are two formulas we use when we are computing the confidence interval. One is used when we […]
Series of Posts This series of post is called inferential statistics and is meant as a brief introduction […]
Visualizing data is the most intuitive way to interpret it, so it’s an invaluable skill. It is much […]
Are you starting out in your exploration of what it is like to be a data professional? This […]
Wikipedia says: “Gapminder Foundation is a non-profit venture registered in Stockholm, Sweden, that promotes sustainable global development and […]
We have several options for accessing datasets that compare countries and include indicators like GDP per capita. This […]