
DBeaver Database
DBeaver is a SQL client software application and a database administration tool for relational databases. DBeaver Community is […]
DBeaver is a SQL client software application and a database administration tool for relational databases. DBeaver Community is […]
A RACI matrix defines project roles and responsibilities, providing a comprehensive chart of who is responsible, accountable, consulted, […]

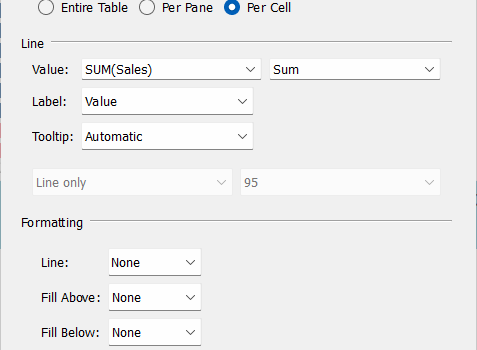
The line chart is useful and popular. It is very popular in data analytics when you are observing […]

In Tableau, are you needing to chart showing two measures (numerical) and one category? For example, suppose you […]

This post contains one example of creating a section header in a Microsoft Word document. This “style” might […]

How do you set up columns of text in Microsoft Word? By default there is only one column. […]

This post discusses how to create a bar chart in Tableau showing a continuous quantitative variable, such as […]
We need to create a horizontal bar chart displaying Sales split by Gender and Sub-category. The sub-category in […]

The bar chart is perhaps the most used and most popular chart. It is very popular in data […]
This series of posts, Starting with Tableau, covers some of the fundamentals of creating visualizations in Tableau. In […]

In Tableau, the Filters shelf appears above the Marks card and is a place where you can specify […]

In Tableau, Shelves and Cards can hold fields. As you know, fields are the columns of data in […]