Suppose we have a table of data that lists employees and their annual salaries. We want to create a new column of data that helps to describe the salaries. We want to use low, average, moderate, and high. Perhaps we want this because we intend to filter by these groups and look at them separately. We want to create categorical data that is ordinal. This is sometimes called feature engineering.
In Excel’s Power Query it is fairly easy to do. We are going to use Column From Examples, From Selection. That’s found in the Add Column menu. To start this process, simply begin typing your ordinal categories in the Column1 provided. Find examples of low, average and so on. Power Query will learn from the examples. Be sure to include at least one example for each of the categories. It will take a best guess as to the boundaries of your categories, which you can later adjust in the M code. So we are letting Power Query write the M code for us, which is the hardest part, and we just adjust the numbers.
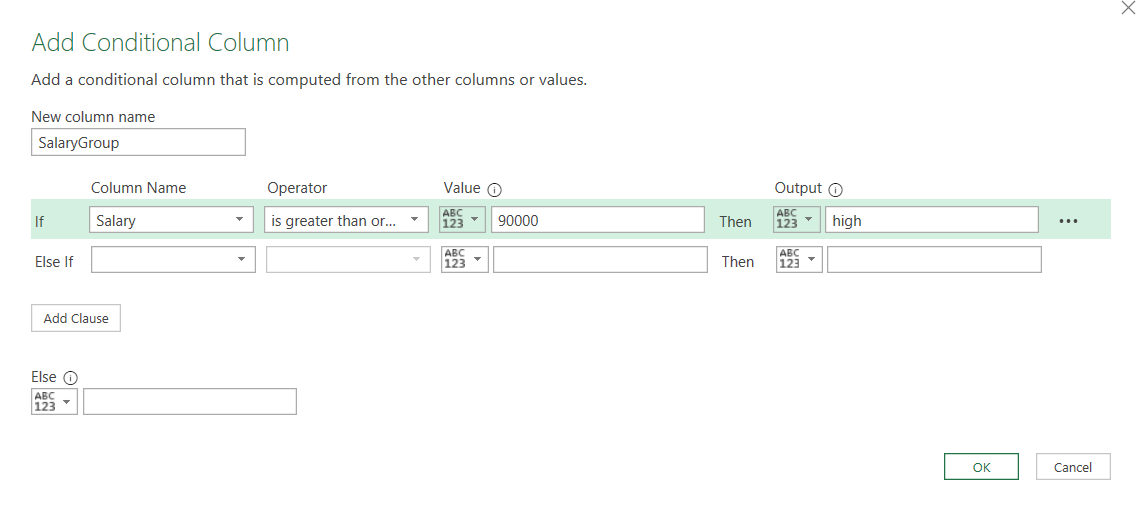
Conditional Columns
This is another way to do this same task above. From Excel, click inside your table, go to Data, From Table/Range and get into Power Query.
Below is the M code, that I adjusted.
= Table.AddColumn(#"Changed Type", "SalaryGroup", each if [Salary] >= 100000 then "high" else if [Salary] >= 60000 then "moderate" else if [Salary] >= 40000 then "average" else "low")