
Correlation Heatmap in Python
A heatmap is a type of data visualization that depicts the magnitude of an instance or set of […]
A heatmap is a type of data visualization that depicts the magnitude of an instance or set of […]

I created a project in a Jupyter Notebook under Anaconda that’s called Distribution Plots in Seaborn. For this […]

Exploratory Data Analysis (EDA) has six main practices. The six main practices of EDA are discovering, structuring, cleaning, […]
At the seaborn website there is an article called Controlling Figure Aesthetics. There is another article called Choosing […]
What is seaborn? Seaborn is a visualization library for making statistical graphics in Python. It builds on top […]

The seaborn library of Python has a built-in dataset that a data professional can easily use to learn […]

Are you are a data professional who is interested in generating a histogram in Python? Suppose you are […]

The Diamonds dataset comes with seaborn, which is a Python library. Below is some Python code you can […]

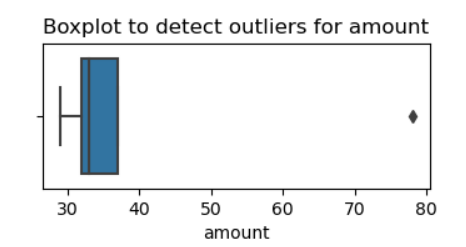
How do you create boxplots in Python’s seaborn? Why would you want to create boxplots in the first […]

How do you take a pandas DataFrame of data (dataset) and produce a multi-column bar chart? You can […]
Exploratory Data Analysis (EDA) has six main practices. The six main practices of EDA are discovering, structuring, cleaning, […]