
Encode Category to Ordinal Numeric
For this example, I will use Python. Are you a data professional working with a dataset that contains […]
For this example, I will use Python. Are you a data professional working with a dataset that contains […]

A heatmap is a type of data visualization that depicts the magnitude of an instance or set of […]
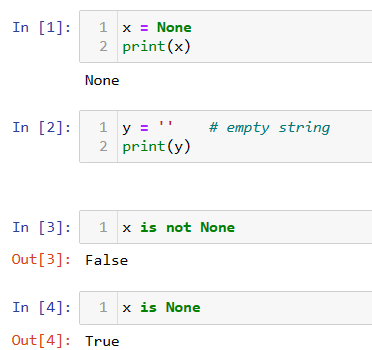
In Python, the built-in value for null is None. To experiment with this I have created a Jupyter […]

Are you needing to split a string inside a column of a pandas DataFrame? Do you want to […]
Do you need to parse a delimited string in Python? Is you string comma-delimited? Are there several strings […]
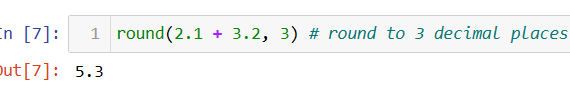
One important thing to know when you are programming in Python, is how Python deals with floating point […]

Exploratory Data Analysis (EDA) has six main practices. The six main practices of EDA are discovering, structuring, cleaning, […]
At the seaborn website there is an article called Controlling Figure Aesthetics. There is another article called Choosing […]
What is seaborn? Seaborn is a visualization library for making statistical graphics in Python. It builds on top […]
Are you exploring a dataset using Python? If you are in your initial discovery phase, you might want […]

This Python project example was done using Jupyter Notebook in Anaconda Navigator with made-up fake made-up data on […]

Binomial means two. Let’s review. Logistic regression is a technique that models a categorical dependent variable Y based […]