- Excel Pivot Tables Introduction
- Pivot Table Data Structure
- Pivot Table Example
- Pivot Table Sales Data Example
- Create a Pivot Table from Multiple Sheets using Power Query
Let’s look at some Sales data in a simple example and use Pivot Table to summarize the data. Here we have units sold and dollar revenue for a list of products sold. We describe each product by the group (type) they are in. We also describe the product by where it was sold. To do that we have a Store column. We also describe the data with when. We have a year column and a Month column.
When we describe and present the data we are telling a story. Quantitative stories are always about relationships. Numbers don’t mean anything unless they relate to something. They need to measure something.
Quantitative stories feature two types of data: quantitative and categorical. Quantitative values measure things and categories divide information into useful groups.
Sales Data Example by Wayne L. Winston
Here is a sample of some sales data from the book by Wayne Winston called Microsoft Excel Data Analysis and Business Modelling (Office 2021 and Microsoft 365) 7th Edition published by Microsoft Press. It’s on page 485.

Units and Revenue are quantitative and the rest are categorical.
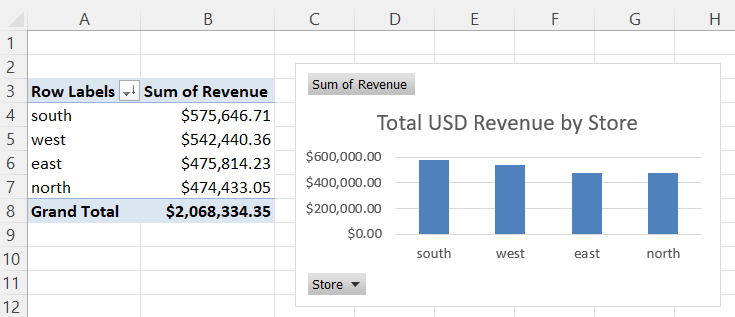
Here below is a simple Pivot table with the Store as Rows and the Revenue as Values.

The pivot table numbers were formatted as Currency. Select a number. Right-click, Number Format…, Currency, and OK.
Below is a screenshot of total USD sales by product.