
Excel Chart Formatting
As an example I will use a simple column chart with only one series of data. It shows […]
As an example I will use a simple column chart with only one series of data. It shows […]
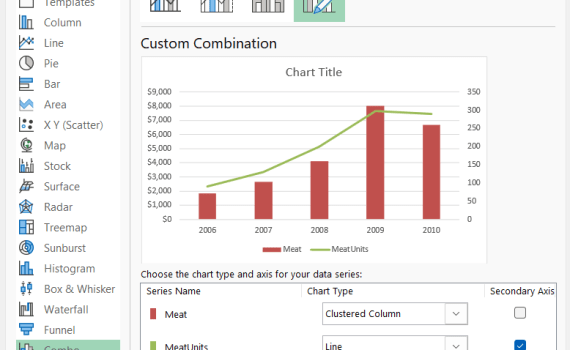
What is an Excel Combo chart? A combo chart in Excel displays two chart types (such as column […]

In this example we will have a simple column chart that will exclude a column of data from […]

Have you ever been frustrated with creating a simple graph showing years in one column and a bunch […]
Let’s look at the video at Udemy.com called Power BI – The Ultimate Orientation by Paula Guilfoyle. The […]

Tableau is an American interactive data visualization software company focused on business intelligence. Business intelligence comprises the strategies […]
You can download the Microsoft Power BI Desktop here. It is over 300MB, so it might take a […]

What is Power BI? First of all, BI stands for Business Intelligence. Power BI is part of the […]