
Tableau Superstore Customer Dashboard
It’s time to build a dashboard in Tableau that’s based on three worksheets I’ve already built using the […]
It’s time to build a dashboard in Tableau that’s based on three worksheets I’ve already built using the […]
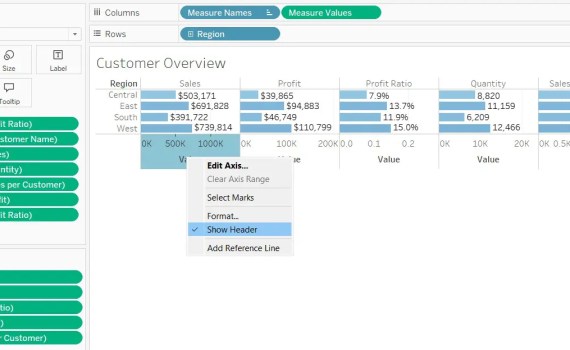
Using the included dataset Sample – Superstore, let’s build the top of our dashboard by displaying several metrics […]

How would you create a chart in Tableau that shows all of your customers ranked by sales, in […]

If are wishing to compare two continuous variables in a dataset you could use a scatterplot. In Tableau, […]

Tableau Reader is a free Desktop software package by Tableau that you can use to open and interact […]

Before diving into quick table calculations in Tableau you’ll want to review calculated fields if you need refreshing. […]

Dates are special in Tableau and require special attention. In Tableau, once a field is identified as a […]

How do you visually show some of the product subcategories in a bar graph in Tableau? Let’s consider […]

Tableau Desktop is software that allows you to connect to and visualize your data quickly. It allows you […]

The line chart is useful and popular. It is very popular in data analytics when you are observing […]

In Tableau, are you needing to chart showing two measures (numerical) and one category? For example, suppose you […]

The bar chart is perhaps the most used and most popular chart. It is very popular in data […]