
Scatterplots in Tableau
If are wishing to compare two continuous variables in a dataset you could use a scatterplot. In Tableau, […]
If are wishing to compare two continuous variables in a dataset you could use a scatterplot. In Tableau, […]

I created a project in a Jupyter Notebook under Anaconda that’s called Distribution Plots in Seaborn. For this […]

You are modelling a decision tree in Python with the plot_tree function of sklearn.tree. How do you interpret […]

How do you create boxplots in Python’s seaborn? Why would you want to create boxplots in the first […]

How do you take a pandas DataFrame of data (dataset) and produce a multi-column bar chart? You can […]

Matplotlib is a library in Python language. In order to write this blog post I created a new […]
Exploratory Data Analysis has six phases: discovering, structuring, cleaning, joining, validating and presenting. The first phase is discovery. […]
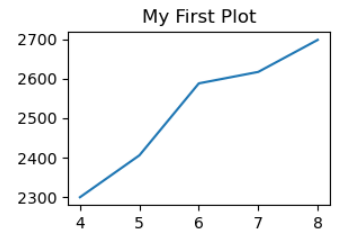
Matplotlib is a low level graph plotting library in python that serves as a visualization utility. Matplotlib was […]
Communicating your work is an important step in your work as an analyst. There are other methods for […]
We can use the ggplot2 facet functions to display our data in new ways. Facet functions let you […]
The ggplot2 package lets you make high-quality, customizable plots of your data. ggplot2 is based on the grammar […]