
Visual Grouping in Tableau
How do you visually show some of the product subcategories in a bar graph in Tableau? Let’s consider […]
How do you visually show some of the product subcategories in a bar graph in Tableau? Let’s consider […]
What is cohort analysis? Cohort analysis is a type of behavioral analytics in which you take a group […]

How do you take a pandas DataFrame of data (dataset) and produce a multi-column bar chart? You can […]

The Pandas groupby method is used for grouping the DataFrame data according to the categories and applying a […]
In R, count() lets you quickly count the unique values of one or more variables: df %>% count(a, […]
The group_by function is often combined with other functions. In the console. Palmer Penguins The penguin data has […]
The summarise function in R returns one row for each combination of grouping variables. Note that summarise() and […]

Summarizing tables with GROUP BY is very common and a must-have skill for the data analyst. This post […]
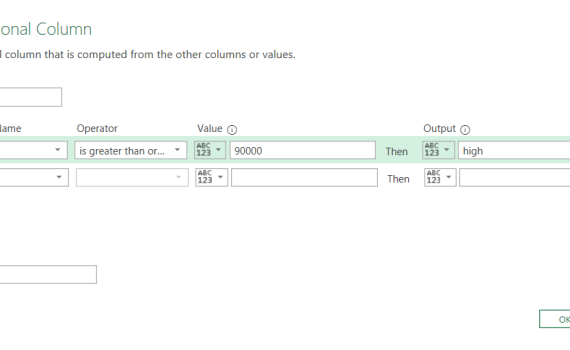
Suppose we have a table of data that lists employees and their annual salaries. We want to create […]
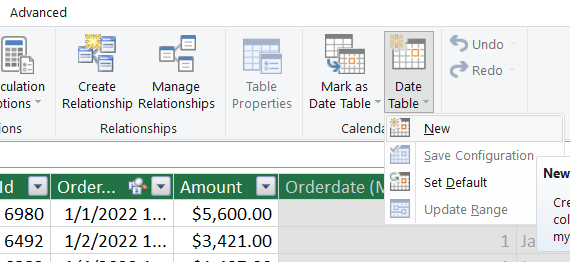
Dates can be a bit tricky. For the best solution to working with dates in our Pivot Table […]
The GroupBox is a familiar control for organizing numerous controls. You might use it to surround a group […]

You can force two columns, or rows, in a WPF Grid Panel to be the same size. How […]