Interquartile Range (IQR)
The middle 50% of your data is called the interquartile range, or IQR. The interquartile range is the […]
The middle 50% of your data is called the interquartile range, or IQR. The interquartile range is the […]
This is a dataset on Kaggle. The title of the Kaggle project is the same as the title […]

I created a project in a Jupyter Notebook under Anaconda that’s called Distribution Plots in Seaborn. For this […]
Are you a data analyst or are you working on a data analysis project and you are wondering […]
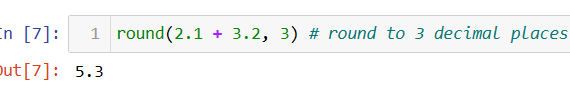
One important thing to know when you are programming in Python, is how Python deals with floating point […]

This is a very simple example of building a decision tree model on a very small dataset that […]
Are you working in Python? Do you want to build a decision tree? Let’s work though this workflow […]
A random forest is a collection of decision trees whose results are aggregated into one final result. Their […]

This post will discuss the building of a logistic regression model on the Titanic dataset provided by Kaggle. […]

Exploratory Data Analysis (EDA) has six main practices. The six main practices of EDA are discovering, structuring, cleaning, […]
At the seaborn website there is an article called Controlling Figure Aesthetics. There is another article called Choosing […]
What is seaborn? Seaborn is a visualization library for making statistical graphics in Python. It builds on top […]