
Bar Chart with Hierarchy
This post discusses how to create a bar chart in Tableau showing a continuous quantitative variable, such as […]
This post discusses how to create a bar chart in Tableau showing a continuous quantitative variable, such as […]
We need to create a horizontal bar chart displaying Sales split by Gender and Sub-category. The sub-category in […]

The bar chart is perhaps the most used and most popular chart. It is very popular in data […]
This series of posts, Starting with Tableau, covers some of the fundamentals of creating visualizations in Tableau. In […]

In Tableau, the Filters shelf appears above the Marks card and is a place where you can specify […]

In Tableau, Shelves and Cards can hold fields. As you know, fields are the columns of data in […]

In Tableau, a calculated field performs calculations that may be based on other fields. Think of a spreadsheet […]

Tableau, the popular visualization software, uses the terms dimensions and measures. What do these mean? First of all […]
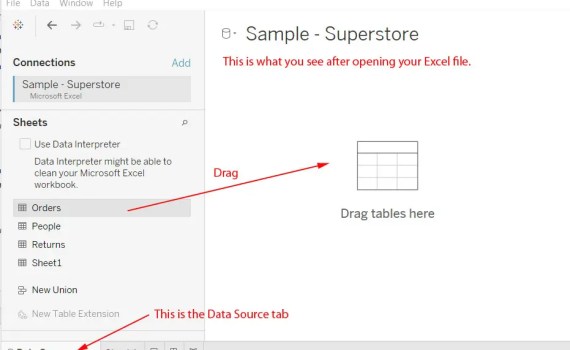
What is Tableau Public Desktop? First of all, Tableau Public is a place on the internet where you […]
Deep learning is a subset of machine learning, which in turn falls under the broader umbrella of artificial […]
57. Let’s do a hypothesis test on a single population. Either we either know the population variance or […]

Every distribution can be standardized. How we can obtain a standard normal distribution from any normally distributed data […]