Alpine.js for Beginners
What is Alpine.js? Written by ChatGPT. Alpine.js is a tiny JavaScript framework that gives your HTML superpowers. If […]
What is Alpine.js? Written by ChatGPT. Alpine.js is a tiny JavaScript framework that gives your HTML superpowers. If […]
The OpenAI Agents SDK is a lightweight and flexible framework for building agentic systems. It’s intentionally not opinionated […]
How do you access Microsoft Copilot in Windows 11?
Our previous post intoduces SPAR. Why SPAR Matters for AI Agents SPAR highlights how AI agents go beyond […]
The lead author, Pascal Bornet, is recognized globally for his work in intelligent automation and AI in business. […]
This series of posts, Starting with Tableau, covers some of the fundamentals of creating visualizations in Tableau. In […]
What is logistic regression? It is part of the general statistics area of regression. Some other types of […]
Artificial intelligence (AI) is a big topic. You’ve heard of it, but what is it? Artificial intelligence refers […]
Data engineering is the practice of designing and building systems for collecting, storing, and analyzing data. It’s about […]
Pandas is an open-source library that is made mainly for working with relational or labeled data in Python. […]
Exploratory Data Analysis (EDA) is a very important process for the data analytics professional because you cannot do […]
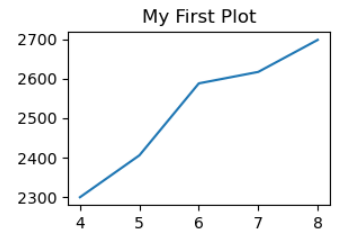
Matplotlib is a low level graph plotting library in python that serves as a visualization utility. Matplotlib was […]