This code is from the YouTube video by Ken Jee Beginner Kaggle Data Science Project Walk-Through (Housing Prices) | With ChatGPT. Thanks Ken Jee and thanks to ChatGPT. That video is one hour long on YouTube. In the video, Ken talks about the function at time 11:26. I’m using Jupyter Notebook in Anaconda Navigator.
from IPython.display import display, HTML # for Scrollable Window
As an example dataset, I will use the Palmer Penguins dataset.
import seaborn as sns
# Load the palmer penguins dataset
penguins = sns.load_dataset("penguins")
Create the funtion that will generate the scrollable window.
# function to create scrollable table within a small window
from IPython.display import display, HTML
def create_scrollable_table(df, table_id, title):
    html = f'<h3>{title}</h3>'
    html += f'<div id="{table_id}" style="height:120px; overflow:auto;">'
    html += df.to_html()
    html += '<div>'
    return html
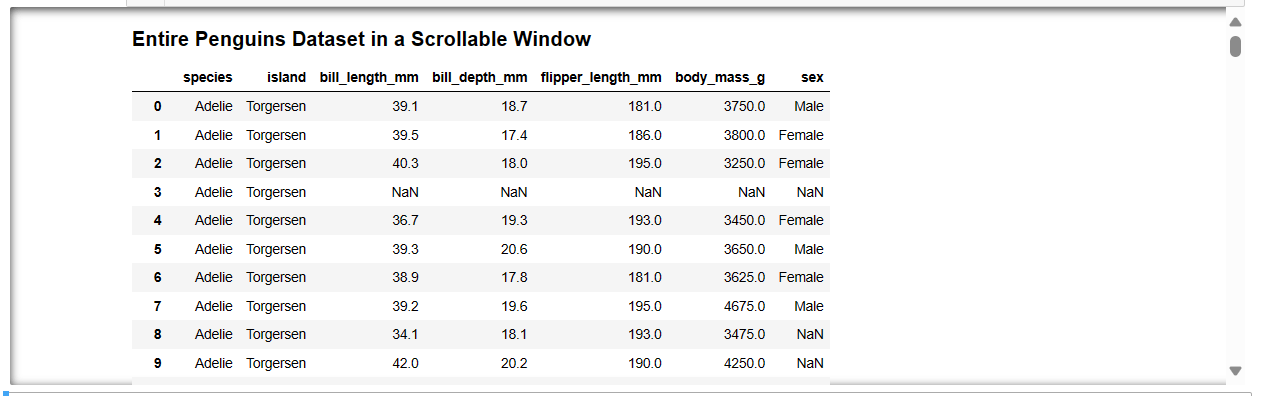
html_numerical = create_scrollable_table(penguins, 'd', 'Entire Penguins Dataset in a Scrollable Window')
display(HTML(html_numerical))
Below is the screenshot as it appears in Jupyter Notebook.
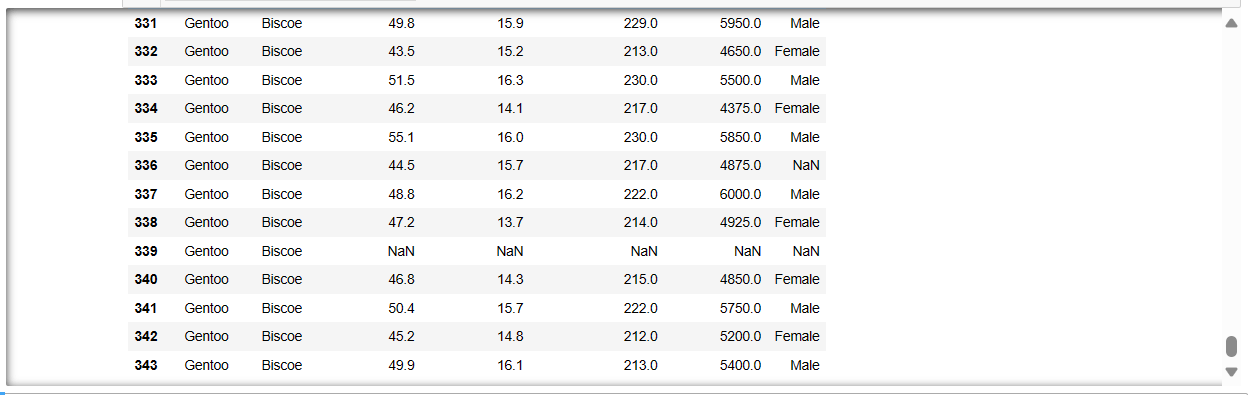
Below is another screenshot of the bottom of the scrollable window, just to prove that it works.