
Tableau Superstore Customer Dashboard
It’s time to build a dashboard in Tableau that’s based on three worksheets I’ve already built using the […]
It’s time to build a dashboard in Tableau that’s based on three worksheets I’ve already built using the […]
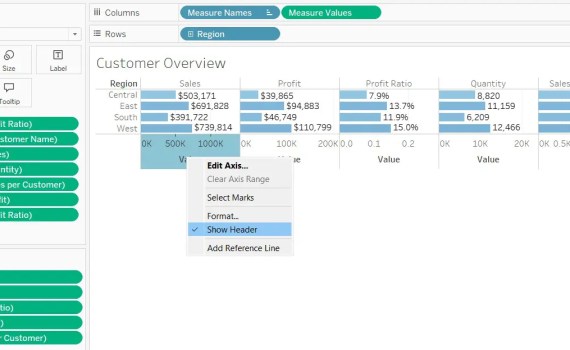
Using the included dataset Sample – Superstore, let’s build the top of our dashboard by displaying several metrics […]

How would you create a chart in Tableau that shows all of your customers ranked by sales, in […]
The six main Key Performance Indicator (KPI) types according to Bernard Marr in this book Key Performance Indicators […]

If are wishing to compare two continuous variables in a dataset you could use a scatterplot. In Tableau, […]
Dashboards are a powerful way to bring multiple charts together into a single view and is even more […]
What is a KPI? A KPI is a relevant measure of performance. KPIs are a measure of how […]
Florence Nightingale saved lives by creating revolutionary visualizations of statistics. Yes, data visualizations are that powerful. They are […]

With Tableau, we can create maps. All we need to do is drag geographic data to our worksheet […]

Data Guide in Tableau provides helpful information about dashboards and insights about the data behind them. It allows […]

Tableau Reader is a free Desktop software package by Tableau that you can use to open and interact […]

Creating subtitles in Tableau is easy because Tableau provides and editor window for you to format the title […]