A Pandas DataFrame is a two-dimensional data structure, with “rows” and “columns”, like a two-dimensional array, or a table. A DataFrame represents a rectangular table of data and contains an ordered collection of columns, each of which can be a different value type (numeric, string, boolean, etc.). The DataFrame has both a row and column index.
There are many ways to construct a DataFrame, though one of the most common is from a dict of equal-length lists or NumPy arrays. Here below is some code from w3schools.com.
import pandas as pd
data = {
  "calories": [420, 380, 390],
  "duration": [50, 40, 45]
}
#load data into a DataFrame object:
df = pd.DataFrame(data)
print(df)
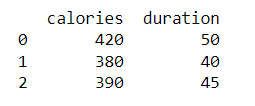
The ouput will look something like the following.
calories duration
0 420 50
1 380 40
2 390 45
It looks a little better in Jupyter Notebook, as shown below. Just run df instead of print(df).
Learn with Udemy
There are lot of courses out there, but Alex the Analyst recommends Data Analysis with Pandas and Python ay udemy by Boris Paskhaver. There are of course many other videos you can check out as well.
Learn with Books
Have a look at the online book by Wes McKinney. Feel free to purchase it as well. I did and it’s been very helpful. Here is the link to the chapter called Getting Started with pandas.
