Tableau’s tooltips are a great way to add additional context or information to your view without taking up any real estate on the worksheet. This is particularly important when the worksheet is on a dashboard. You can populate the tooltip with as much information as needed including dynamic fields. These fields will update when the user clicks on or hovers the mouse over a mark in the view. As a result, tooltips are very useful in building interactivity and reinforcing your story for your views.
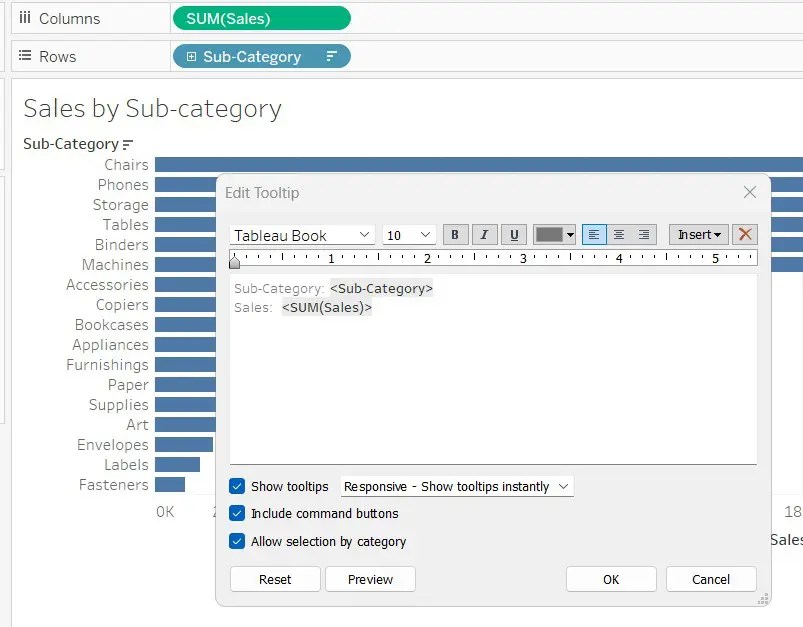
How do we edit the tooltip? Start by going to the Marks card then click on the Tooltip button. This will allow you to edit the tooltip. The content of the text box is based on the chart, listing the fields currently used in the view by default. The fields in the box you can see here are designed in brackets.
Include in Tooltip but not in Chart
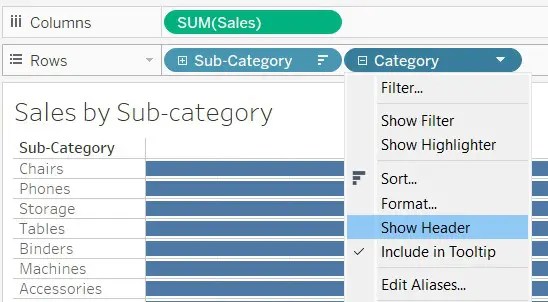
Suppose you want to include the Category in the tooltip, but you don’t want to show it in your chart. You can add the Category pill to the chart and remove the category form showing. How do you do that? You can uncheck Show Header. After you uncheck Show Header, the check mark will no longer appear, as shown below.
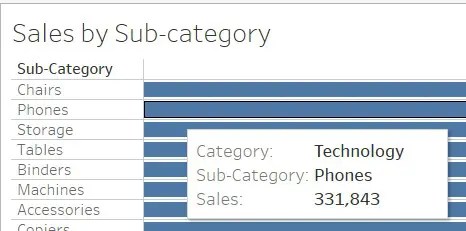
Here is how the tooltip looks. Here we have been able to include the Category in the tooltip without having to show it in the chart.