A Data Flow Diagram (DFD) is a simple but powerful tool for showing how information moves through a system. It uses circles or processes, arrows for data flows, rectangles for external entities, and parallel lines for data stores. Together these elements provide a clear visual of inputs, outputs, and transformations.
Why DFDs Matter
DFDs help analysts, developers, and business users see where data comes from, how it is processed, and where it goes. They are easy to understand, even for non-technical stakeholders, making them a favorite technique in the BABOK toolkit.
Levels of DFDs
- Context Diagram (Level 0): Shows the system as one process and its interactions with external entities.
- Level 1: Breaks the main process into sub-processes and shows data stores.
- Level 2 and beyond: Adds more detail, drilling down into processes.
An Example
Consider a curriculum committee that approves and schedules speakers. That data then flows into a central events database. From there, it feeds multiple outputs: brochures, website calendars, rack cards, and handouts. A DFD makes this flow visible and highlights where bottlenecks or errors might occur.
DFD vs. Flowcharts
Unlike flowcharts, which show the order of tasks, DFDs emphasize the movement of data between processes. This makes them ideal when the focus is on information rather than just activities.
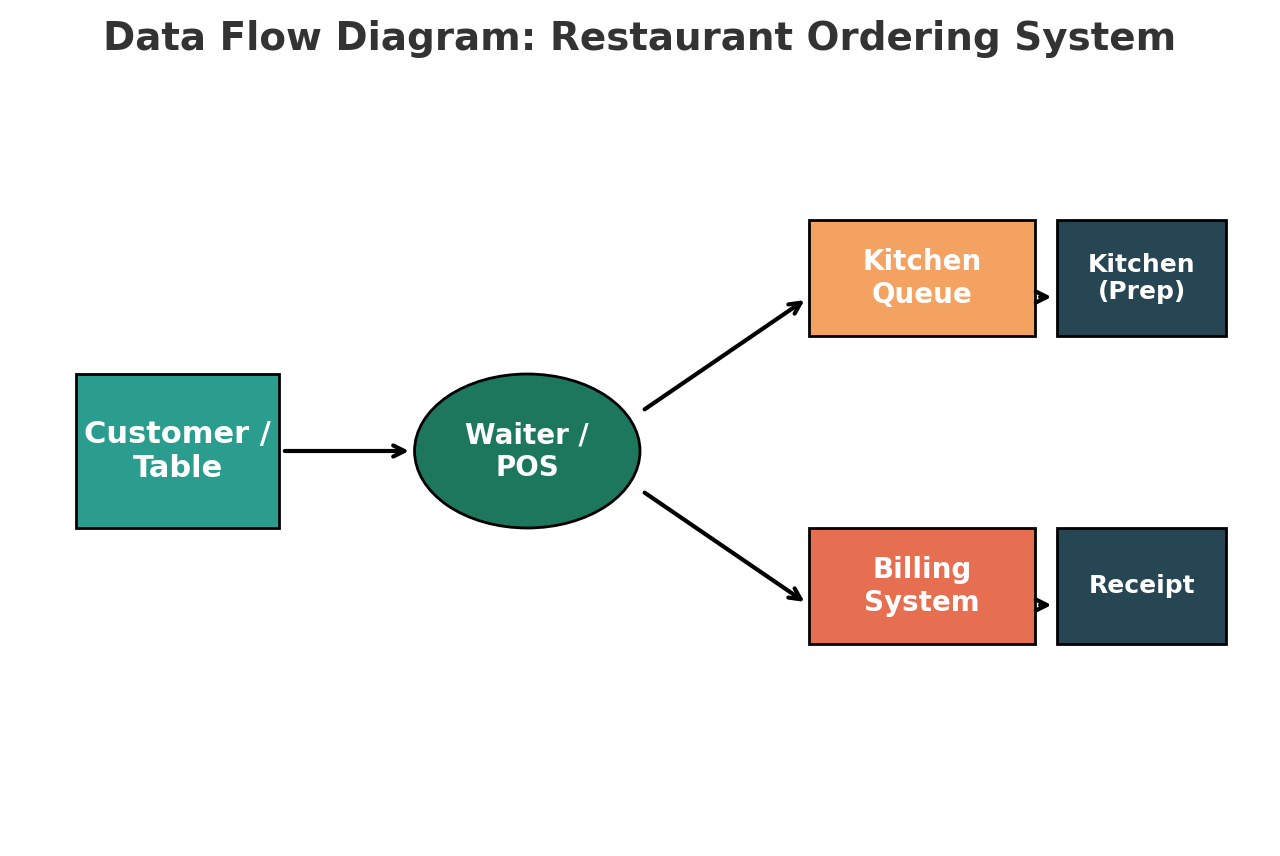
Restaurant Example
A restaurant example is simple and intuitive. Let’s map that out into a Level )/Level1 DFD.
- External Entity: Customer/Table (table number + party size)
- Process: Waiter / POS System (takes the order)
- Data Stores:
- Kitchen Queue (list of meals to prepare)
- Billing System (records order, calculates bill)
- Processes/Outputs:
- Meal Preparation (Kitchen) → delivers food
- Receipt → given to customer
Closing Thoughts
Though often associated with IT, Data Flow Diagrams are versatile tools for any organization that needs to understand how information flows. They are simple, visual, and scalable—helping everyone from committees to software teams ensure that data moves where it should.