- Scatterplots in Tableau
- Customer Sales Ranking in Tableau
- Customer Overview in Tableau
- Tableau Superstore Customer Dashboard
How would you create a chart in Tableau that shows all of your customers ranked by sales, in a bar chart? I will use the Superstore dataset that comes with Tableau to illustrate how to do this chart. Here below is the final result in a screenshot. I am hovering over the bar of Tamara Chand to show the tooltip.
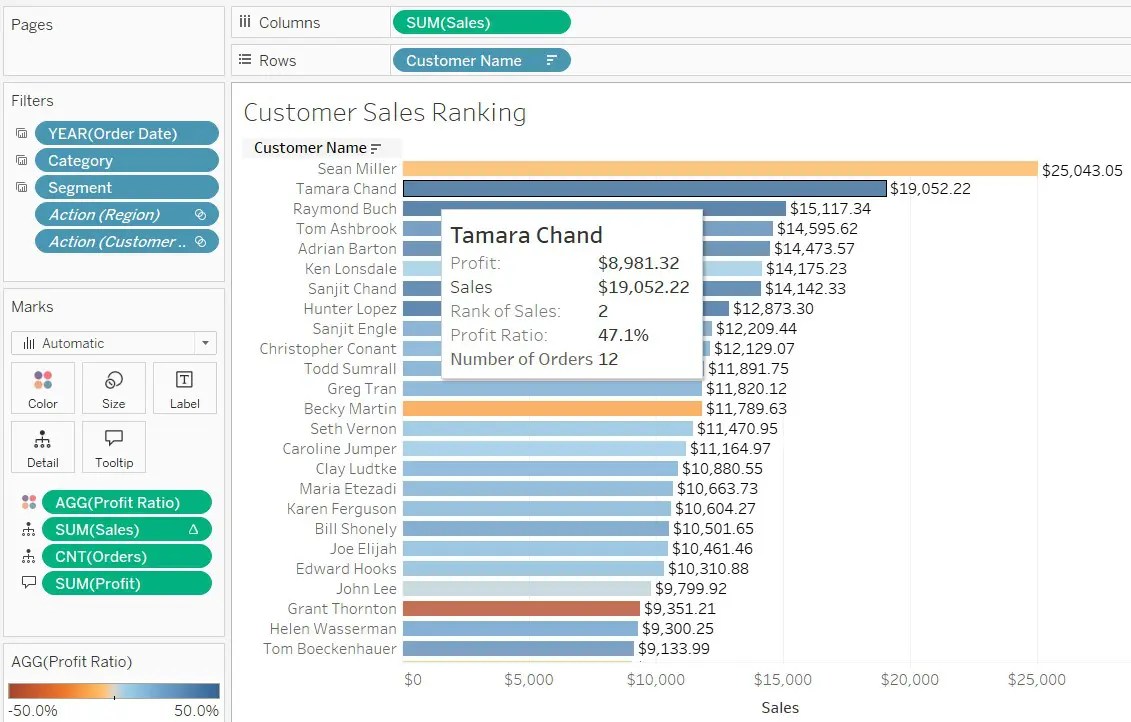
Add Sales to Columns. Add Customer Name to Rows. Add Profit Margin to Color marks card. The very next thing to do is to sort the customers by sales. Click on the down arrow of the Customer Name pill in the Rows shelf and click on Sort. Choose descending, by Field, Sales and Sum is the aggregation. Click OK.
We have no color yet. Drag the Profit Ratio to the Color marks card. Next we’ll adjust the color intensity by first clicking on Color and then Edit Colors. Click Advanced, and check both the Start and End check boxes. For start, enter -.5 and for end enter 0.5.
There are several filters shown in the screenshot which you can ignore for now. There are there for the dashboard I will create later.
Rank of Sales
I have Rank of Sales in the Tooltip, as you can see in the screenshot. That is not part of the dataset. To get that number, I needed to create a table calculation. How do we do this? Go to the SUM(Sales) green pill in the Marks and click on the down arrow. Click on Quick Table Calculation. Click on Rank. Click on Tooltip and feel free to do some formatting. I re-arranged the order of the items in the tooltip.
Labels
Click on Label in the Marks section. Check the Show mark labels check box to put the dollar amounts at the end of the bars. If not every bar is labelled with the dollar amount then check Allow labels to overlap other marks.